|
IN THIS ISSUE:
1a. General Domestic
Equity Mutual Funds — BUYBUY
1b. Domestic
Vanguard Mutual Funds — BUY
1c. Domestic
Fidelity Mutual Funds — BUY
1d. Domestic T. Rowe
Price Mutual Funds — BUY
1e. Domestic, Rydex
and ProFunds Funds — BUY
1f. Domestic
American Century Funds — BUY
2. Exchange Traded
Funds Master List
2a. Domestic
Exchange Traded Funds (ETFs) — BUY
3. International
Equity Mutual Funds/ETFs — BUY
4a. A Global
Perspective — SELECTIVE BUY
4b. Tax-Free
Investing — BUY
4c. Sector Fund
Investing (ETFs) — SELECTIVE
BUY
4d. Fidelity Select
Sector Funds — SELECTIVE BUY
4e. T. Rowe Price,
Rydex, VanguardNEW &
American Century Sector Funds — SELECTIVE BUY
4f. New Venture Opportunity ETFs —
SELECTIVE BUY
5. On the Horizon:
Bear Market Funds — SELL
6. 401(k) Funds
(domestic) — BUY
7. New Subscriber
Info
Weekly Market Comment:
The bulls
continued to party and sent all major indexes higher on overall good news
except for the housing sector.
Our
incremental buying procedure has us now in an almost 100% invested position.
TIP: To export the momentum tables to
your spreadsheet, here is an easy way to use Excel's functions to import the
weekly StatSheet data:
Open a new Excel worksheet. Go to
Data -> Import External Data and select "New Web Query."
In the address window, paste or type
in the link below. Enlarge the window so that you can see it better. By now
you should see my StatSheet tables. Click "Import" on the lower
right hand side. Select the A1 cell and click OK and all of the data is
neatly imported in columns.
You can now format the spreadsheet
and save it. Next week, simply change the address and you can import the
current data.
http://www.successful-investment.com/StatSheet/SSTables052407.htm
Are you interested in reading my
possibly politically incorrect ruminations about the market?
I have
set up a blog, aptly named “The Wall Street Bully,” which will be updated
during the week. It gives you the opportunity to post comments and continue
the dialog. Take a look at it:
http://thewallstreetbully.blogspot.com/
If you
have a newsreader, you can subscribe to it and new updates will be delivered
to you automatically. Alternatively, you can set this link up in your
‘Favorites’ folder and check at your convenience. This is a free service, so
please tell a couple of your friends.
GLOSSARY OF TERMS USED:
1. 4Wk, 8Wk, 12Wk and YTD refer to
how these funds have performed or “appreciated” during these various time
periods.
2. %M/A (39-week Simple Moving
Average) shows how far above or below its long-term trend line a fund/ETF is
currently positioned.
3. “Since 9/6/06” shows a fund’s
performance since that date. This date will be re-set once a new domestic Buy
Cycle starts.
4. DD% (DrawDown percentage) measures the drop from a
fund’s high to its current price during this Buy cycle
(since 9/6/06).
A fund that shows 0.00% has just made a new
high. That’s good news because it confirms that it
is moving up given current given economic conditions—which
were favorable at the time. It is therefore in tune
with market momentum.
Conversely, a fund with a large negative DD% number is a
lagging performer and should not be purchased at this time.
5. MaxDD%
(Maximum DrawDown percentage) is not
shown in these tables, but you will find me mention it quite frequently.
If you were to go back to the beginning of the previous
Buy cycle (10/5/04)
and measure DD% for a given fund every
trading day, and then select the worst (largest) DrawDown
number, you would have the information that I call
MaxDD% (Maximum DrawDown Percentage).
This allows me to look back at anytime and see which funds
have held up best and never hit our 7% sell stop.
Those are the ones with a low MaxDD% (or low volatility)
number and will be among my primary selections
for the next Buy cycle.
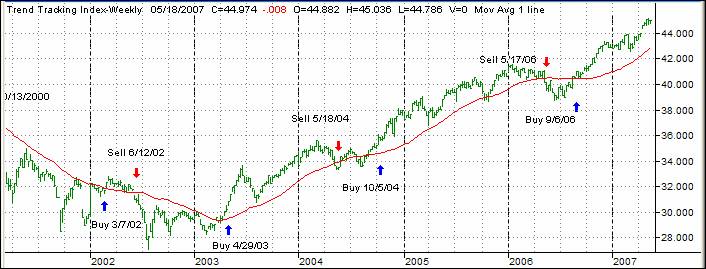
1a. DOMESTIC EQUITY MUTUAL FUNDS: BUY — since 9/6/2006
Our
average portfolio (over $50k) has returned +24.81%, after management fees,
for the Buy Cycle (from 4/29/03
to 5/18/04).
Our average
portfolio (over $50k) has returned +8.10%, after management fees, for the Buy
Cycle (from 10/5/04
to 5/17/06).
Past
performance is not a guarantee of future results.
Our Trend
Tracking Index (TTI) moved higher this week (green line in above chart) and
now remains above its long term trend line (red) by +5.22%.
My sell
rules are as follows: I will liquidate any of my holdings if they drop by
more than 7% from their highs since I bought them, or if the TTI breaks below
its long-term tend line — whichever occurs first.
The first
table below shows the top 25 funds (out of 674) and is sorted by 4Wk
performance. Prices in all tables are updated through 5/17/2007, unless otherwise noted.
Please note, that I only track
no-load, no transaction fee or ‘load waived’ funds, which are available to me
through my custodian Charles Schwab & Co. Since all brokers and
custodians have different policies you need to check with yours first, before
placing any trades, as to no load availability and any charges or fees
involved.
I have identified those
funds, which are available to me as “load waived” funds or “advisor only”
funds, with an asterisk before their names. While this may not apply to all
brokerage firms, it should allow you to quickly locate those which are truly
no load.
|
Ticker
|
Fund Name
|
Orientation
|
4Wk
|
8Wk
|
12Wk
|
YTD
|
%M/A
|
Since 9/6/06
|
DD%
|
|
PDOWX
|
Potomac Dow 30 Plus Inv
|
Large Value
|
3.25%
|
10.95%
|
12.02%
|
9.39%
|
10.97%
|
21.90%
|
-1.06%
|
|
SVLSX
|
*Victory Value A
|
Large Value
|
3.00%
|
7.35%
|
7.92%
|
6.49%
|
8.05%
|
16.02%
|
-0.96%
|
|
ICBMX
|
ICON Materials
|
Mid-Cap Value
|
2.59%
|
7.78%
|
10.38%
|
17.35%
|
10.18%
|
13.62%
|
-2.00%
|
|
LSLTX
|
Leuthold Select Industries
|
Mid-Cap Growth
|
2.54%
|
8.37%
|
10.22%
|
11.25%
|
11.14%
|
23.54%
|
-1.34%
|
|
QUAGX
|
*Quaker Strategic Growth A
|
Large Blend
|
2.53%
|
7.32%
|
10.60%
|
9.88%
|
9.34%
|
14.40%
|
-1.43%
|
|
MGOAX
|
*Munder MidCap Select A
|
Mid-Cap Growth
|
2.51%
|
7.37%
|
10.36%
|
12.89%
|
11.41%
|
21.96%
|
-1.99%
|
|
IHSTX
|
*Hartford
Stock A
|
Large Blend
|
2.12%
|
7.56%
|
9.07%
|
8.48%
|
9.40%
|
20.20%
|
-0.78%
|
|
MSAVX
|
*Van Kampen American Value A
|
Mid-Cap Blend
|
2.11%
|
6.71%
|
7.93%
|
9.25%
|
10.36%
|
23.00%
|
-1.41%
|
|
GALEX
|
*Columbia
Disciplined Value T
|
Large Value
|
2.04%
|
6.38%
|
8.57%
|
8.75%
|
9.37%
|
18.89%
|
-1.04%
|
|
TGVFX
|
*Touchstone Growth Opportunities A
|
Large Growth
|
2.01%
|
7.22%
|
10.62%
|
8.31%
|
9.20%
|
17.75%
|
-1.46%
|
|
HFMCX
|
*Hartford
Midcap A
|
Mid-Cap Growth
|
2.01%
|
7.62%
|
8.89%
|
11.96%
|
10.88%
|
21.36%
|
-1.42%
|
|
HILVX
|
Harbor Large Cap Value Inv
|
Large Value
|
2.00%
|
7.23%
|
8.35%
|
5.08%
|
7.45%
|
16.24%
|
-0.95%
|
|
MVAAX
|
*MainStay Value A
|
Large Value
|
1.93%
|
6.37%
|
7.49%
|
6.80%
|
7.68%
|
15.03%
|
-1.09%
|
|
VGRIX
|
*JP Morgan Growth & Income A
|
Large Value
|
1.93%
|
6.93%
|
8.60%
|
8.28%
|
9.23%
|
19.53%
|
-1.16%
|
|
KDHAX
|
*Scudder Dreman High Return Eq A
|
Large Value
|
1.92%
|
5.85%
|
7.13%
|
5.05%
|
6.77%
|
12.66%
|
-0.95%
|
|
HMERX
|
*HighMark Large Cap Value Ret A
|
Large Value
|
1.91%
|
6.69%
|
8.79%
|
8.30%
|
9.19%
|
18.60%
|
-1.25%
|
|
NPRTX
|
Neuberger Berman Partners Inv
|
Large Blend
|
1.84%
|
8.09%
|
9.69%
|
9.40%
|
11.19%
|
21.79%
|
-1.28%
|
|
MUHLX
|
Muhlenkamp
|
Mid-Cap Value
|
1.84%
|
9.00%
|
9.19%
|
5.21%
|
7.79%
|
14.94%
|
-1.32%
|
|
SSHFX
|
Sound Shore
|
Large Value
|
1.84%
|
4.92%
|
5.30%
|
4.88%
|
6.26%
|
14.70%
|
-0.71%
|
|
ICSLX
|
ICAP Select Equity
|
Large Value
|
1.84%
|
6.48%
|
9.49%
|
8.45%
|
9.48%
|
18.93%
|
-0.90%
|
|
HDOGX
|
Hennessy Total Return
|
Large Value
|
1.81%
|
5.56%
|
6.48%
|
6.55%
|
6.73%
|
12.37%
|
-0.61%
|
|
SRVEX
|
*Victory Diversified Stock A
|
Large Blend
|
1.80%
|
7.10%
|
7.38%
|
6.72%
|
7.88%
|
17.82%
|
-0.99%
|
|
RIMEX
|
Rainier Core Equity
|
Large Blend
|
1.79%
|
6.89%
|
8.83%
|
9.34%
|
8.93%
|
17.96%
|
-1.47%
|
|
TGIGX
|
TCW Galileo Dividend Focused N
|
Large Value
|
1.77%
|
7.17%
|
8.37%
|
8.67%
|
9.07%
|
18.99%
|
-0.83%
|
|
WFMCX
|
*Wells Fargo Montgomery Mid Cap
Growth A
|
Mid-Cap Growth
|
1.75%
|
5.57%
|
6.90%
|
10.73%
|
9.74%
|
20.49%
|
-1.17%
|
The
following list shows the top 25 funds out of the 674 we track, but the
sorting order is by 12wk performance:
|
Ticker
|
Fund Name
|
Orientation
|
4Wk
|
8Wk
|
12Wk
|
YTD
|
%M/A
|
Since 9/6/06
|
DD%
|
|
TWHIX
|
American Century Heritage Inv
|
Mid-Cap Growth
|
1.22%
|
8.00%
|
12.92%
|
17.19%
|
16.16%
|
32.27%
|
-1.88%
|
|
TWCVX
|
American Century Vista
Inv
|
Mid-Cap Growth
|
0.77%
|
7.68%
|
12.06%
|
14.46%
|
12.98%
|
24.04%
|
-1.88%
|
|
SGRIX
|
Strong Growth & Income Inv
|
Large Blend
|
1.29%
|
9.75%
|
12.05%
|
9.65%
|
11.19%
|
26.31%
|
-0.89%
|
|
PDOWX
|
Potomac Dow 30 Plus Inv
|
Large Value
|
3.25%
|
10.95%
|
12.02%
|
9.39%
|
10.97%
|
21.90%
|
-1.06%
|
|
TGVFX
|
*Touchstone Growth Opportunities A
|
Large Growth
|
2.01%
|
7.22%
|
10.62%
|
8.31%
|
9.20%
|
17.75%
|
-1.46%
|
|
QUAGX
|
*Quaker Strategic Growth A
|
Large Blend
|
2.53%
|
7.32%
|
10.60%
|
9.88%
|
9.34%
|
14.40%
|
-1.43%
|
|
BUFEX
|
Buffalo Large Cap
|
Large Blend
|
0.09%
|
8.00%
|
10.54%
|
12.07%
|
10.45%
|
20.40%
|
-1.09%
|
|
HGOAX
|
*Hartford
Growth Opportunities A
|
Mid-Cap Growth
|
1.45%
|
8.43%
|
10.52%
|
10.28%
|
10.70%
|
22.09%
|
-1.68%
|
|
ICBMX
|
ICON Materials
|
Mid-Cap Value
|
2.59%
|
7.78%
|
10.38%
|
17.35%
|
10.18%
|
13.62%
|
-2.00%
|
|
MGOAX
|
*Munder MidCap Select A
|
Mid-Cap Growth
|
2.51%
|
7.37%
|
10.36%
|
12.89%
|
11.41%
|
21.96%
|
-1.99%
|
|
UMBIX
|
Excelsior Value & Restructuring
|
Large Value
|
1.39%
|
8.12%
|
10.24%
|
11.68%
|
11.50%
|
22.59%
|
-1.40%
|
|
LSLTX
|
Leuthold Select Industries
|
Mid-Cap Growth
|
2.54%
|
8.37%
|
10.22%
|
11.25%
|
11.14%
|
23.54%
|
-1.34%
|
|
LMGFX
|
Legg Mason Growth Trust F. I. Shares
|
Large Growth
|
1.53%
|
10.42%
|
10.21%
|
10.55%
|
11.34%
|
24.21%
|
-1.27%
|
|
ANOAX
|
*American Century New Oppor II A
|
Small Growth
|
0.77%
|
7.36%
|
10.19%
|
12.76%
|
11.40%
|
22.53%
|
-2.13%
|
|
JAEIX
|
Janus Core Equity
|
Large Blend
|
1.69%
|
8.11%
|
10.09%
|
9.38%
|
9.43%
|
17.59%
|
-1.06%
|
|
JAMRX
|
Janus Mercury
|
Large Growth
|
0.24%
|
6.98%
|
10.02%
|
14.51%
|
12.14%
|
25.71%
|
-1.51%
|
|
RYNVX
|
Rydex Nova Inv
|
Large Blend
|
1.05%
|
7.86%
|
9.84%
|
8.47%
|
9.79%
|
23.19%
|
-1.70%
|
|
FUNDX
|
FundX Upgrader (2%-30)
|
Mid-Cap Blend
|
0.24%
|
5.90%
|
9.83%
|
4.10%
|
8.18%
|
14.42%
|
-1.37%
|
|
FGSAX
|
*Federated Mid Cap Growth Strategies A
|
Mid-Cap Growth
|
0.17%
|
7.80%
|
9.83%
|
13.53%
|
11.59%
|
24.76%
|
-1.52%
|
|
ETMGX
|
*Eaton Vance Tax-Mgd Sm-Cap Gr 1.1 A
|
Small Growth
|
0.95%
|
7.55%
|
9.79%
|
15.70%
|
13.24%
|
28.23%
|
-1.99%
|
|
JAGIX
|
Janus Growth & Income
|
Large Growth
|
1.64%
|
7.67%
|
9.73%
|
8.73%
|
8.69%
|
15.41%
|
-1.02%
|
|
RIMSX
|
Rainier Small/Mid Cap Equity
|
Mid-Cap Growth
|
1.39%
|
6.83%
|
9.72%
|
13.41%
|
11.86%
|
23.80%
|
-2.04%
|
|
JSVAX
|
Janus Contrarian Fund
|
Mid-Cap Blend
|
0.41%
|
8.13%
|
9.71%
|
14.25%
|
13.85%
|
31.15%
|
-1.67%
|
|
NPRTX
|
Neuberger Berman Partners Inv
|
Large Blend
|
1.84%
|
8.09%
|
9.69%
|
9.40%
|
11.19%
|
21.79%
|
-1.28%
|
|
JORNX
|
Janus Orion
|
Mid-Cap Growth
|
1.00%
|
7.57%
|
9.69%
|
11.57%
|
11.19%
|
25.45%
|
-1.60%
|
In the
following table, the data has been filtered as follows:
It only
shows the top 25 funds with positive numbers in all momentum columns and a
DrawDown feature of less than -5% (DD%). The sorting order is by 4 weeks.
The
result is that only those funds with consistent performance in all areas are displayed,
which to me represent the top choices for fund selections. Out of a possible
674, 538 funds qualified and the top 25 are listed this week:
|
Ticker
|
Fund
Name
|
Orientation
|
4Wk
|
8Wk
|
12Wk
|
YTD
|
%M/A
|
Since 9/6/06
|
DD%
|
|
RYCVX
|
Rydex Dybamic Dow
(200%)
|
Large
Value
|
5.05%
|
17.73%
|
19.47%
|
14.36%
|
16.98%
|
34.93%
|
-1.73%
|
|
PDOWX
|
Potomac Dow 30 Plus Inv
|
Large
Value
|
3.25%
|
10.95%
|
12.02%
|
9.39%
|
10.97%
|
21.90%
|
-1.06%
|
|
SVLSX
|
*Victory Value A
|
Large
Value
|
3.00%
|
7.35%
|
7.92%
|
6.49%
|
8.05%
|
16.02%
|
-0.96%
|
|
IYJ
|
Dow Jones US
Industrial
|
Large
Blend
|
2.92%
|
7.62%
|
8.69%
|
10.46%
|
10.05%
|
20.84%
|
-0.81%
|
|
XLI
|
Industrial Select
Sector
|
Large
Value
|
2.85%
|
7.44%
|
8.48%
|
9.31%
|
8.77%
|
18.81%
|
-0.80%
|
|
RKGRX
|
Rockland Small Cap Growth
|
Small
Growth
|
2.70%
|
6.10%
|
6.98%
|
6.98%
|
7.16%
|
15.65%
|
-2.30%
|
|
ICBMX
|
ICON Materials
|
Mid-Cap
Value
|
2.59%
|
7.78%
|
10.38%
|
17.35%
|
10.18%
|
13.62%
|
-2.00%
|
|
LSLTX
|
Leuthold Select
Industries
|
Mid-Cap
Growth
|
2.54%
|
8.37%
|
10.22%
|
11.25%
|
11.14%
|
23.54%
|
-1.34%
|
|
QUAGX
|
*Quaker Strategic
Growth A
|
Large
Blend
|
2.53%
|
7.32%
|
10.60%
|
9.88%
|
9.34%
|
14.40%
|
-1.43%
|
|
MGOAX
|
*Munder MidCap
Select A
|
Mid-Cap
Growth
|
2.51%
|
7.37%
|
10.36%
|
12.89%
|
11.41%
|
21.96%
|
-1.99%
|
|
DIA
|
DIA Diamond EFT
|
Large
Value
|
2.48%
|
8.85%
|
9.76%
|
7.95%
|
8.98%
|
17.66%
|
-0.84%
|
|
IHSTX
|
*Hartford Stock A
|
Large
Blend
|
2.12%
|
7.56%
|
9.07%
|
8.48%
|
9.40%
|
20.20%
|
-0.78%
|
|
MSAVX
|
*Van Kampen American
Value A
|
Mid-Cap
Blend
|
2.11%
|
6.71%
|
7.93%
|
9.25%
|
10.36%
|
23.00%
|
-1.41%
|
|
GALEX
|
*Columbia Disciplined Value T
|
Large
Value
|
2.04%
|
6.38%
|
8.57%
|
8.75%
|
9.37%
|
18.89%
|
-1.04%
|
|
TGVFX
|
*Touchstone Growth
Opportunities A
|
Large
Growth
|
2.01%
|
7.22%
|
10.62%
|
8.31%
|
9.20%
|
17.75%
|
-1.46%
|
|
HFMCX
|
*Hartford Midcap A
|
Mid-Cap
Growth
|
2.01%
|
7.62%
|
8.89%
|
11.96%
|
10.88%
|
21.36%
|
-1.42%
|
|
HILVX
|
Harbor Large Cap
Value Inv
|
Large
Value
|
2.00%
|
7.23%
|
8.35%
|
5.08%
|
7.45%
|
16.24%
|
-0.95%
|
|
NY
|
NYSE 100 Index
|
Moderate
Allocation
|
2.00%
|
6.79%
|
8.13%
|
6.26%
|
7.46%
|
14.86%
|
-0.83%
|
|
MVAAX
|
*MainStay Value A
|
Large
Value
|
1.93%
|
6.37%
|
7.49%
|
6.80%
|
7.68%
|
15.03%
|
-1.09%
|
|
VGRIX
|
*JP Morgan Growth
& Income A
|
Large
Value
|
1.93%
|
6.93%
|
8.60%
|
8.28%
|
9.23%
|
19.53%
|
-1.16%
|
|
KDHAX
|
*Scudder Dreman High
Return Eq A
|
Large
Value
|
1.92%
|
5.85%
|
7.13%
|
5.05%
|
6.77%
|
12.66%
|
-0.95%
|
|
HMERX
|
*HighMark Large Cap
Value Ret A
|
Large
Value
|
1.91%
|
6.69%
|
8.79%
|
8.30%
|
9.19%
|
18.60%
|
-1.25%
|
|
JKF
|
Morningstar Large
Value
|
Large
Value
|
1.87%
|
6.35%
|
8.61%
|
6.78%
|
8.22%
|
15.30%
|
-1.23%
|
|
NPRTX
|
Neuberger Berman
Partners Inv
|
Large
Blend
|
1.84%
|
8.09%
|
9.69%
|
9.40%
|
11.19%
|
21.79%
|
-1.28%
|
|
MUHLX
|
Muhlenkamp
|
Mid-Cap
Value
|
1.84%
|
9.00%
|
9.19%
|
5.21%
|
7.79%
|
14.94%
|
-1.32%
|
TIP: Don’t forget to check the 401k funds
in section 6 as well, since many of them are available for all types of
investment accounts at different brokerage houses.
1b. DOMESTIC VANGUARD MUTUAL
FUNDS: BUY
If you
prefer using the Vanguard family, here are the most commonly held funds. The
sorting order is by 4wk momentum:
|
Ticker
|
Fund Name
|
Orientation
|
4Wk
|
8Wk
|
12Wk
|
YTD
|
%M/A
|
Since 9/6/06
|
DD%
|
|
VWNFX
|
Vanguard Windsor
II
|
Large Value
|
1.87%
|
6.51%
|
8.09%
|
8.09%
|
8.79%
|
17.33%
|
-0.90%
|
|
VIVAX
|
Vanguard Value Index
|
Large Value
|
1.44%
|
5.78%
|
7.73%
|
6.84%
|
8.11%
|
16.79%
|
-1.02%
|
|
VDIGX
|
Vanguard Dividend Growth
|
Large Value
|
1.41%
|
6.31%
|
7.63%
|
6.45%
|
7.71%
|
16.10%
|
-0.90%
|
|
VUVLX
|
U.S. Value Fund
|
Large Value
|
1.35%
|
5.82%
|
6.82%
|
6.13%
|
6.86%
|
14.35%
|
-0.72%
|
|
VWNDX
|
Vanguard Windsor
Fd
|
Large Value
|
1.35%
|
5.43%
|
6.17%
|
5.89%
|
7.47%
|
18.79%
|
-0.86%
|
|
VCVLX
|
Vanguard Capital Value
|
Large Value
|
1.26%
|
5.53%
|
6.08%
|
9.12%
|
9.66%
|
24.53%
|
-1.11%
|
|
VMGRX
|
Mid-Cap Growth Fund
|
Mid-Cap Growth
|
1.17%
|
5.99%
|
7.04%
|
10.15%
|
8.77%
|
20.13%
|
-1.73%
|
|
VTGIX
|
Tax-Managed Gr. & Inc.
|
Large Blend
|
1.03%
|
5.96%
|
7.45%
|
6.68%
|
7.48%
|
16.57%
|
-1.09%
|
|
VFINX
|
Vanguard 500 Index
|
Large Blend
|
1.00%
|
5.84%
|
7.32%
|
6.56%
|
7.34%
|
16.24%
|
-1.07%
|
|
VAAPX
|
Vanguard Asset Allocation
|
Moderate Allocation
|
0.96%
|
5.36%
|
6.70%
|
6.11%
|
6.95%
|
15.70%
|
-0.85%
|
|
VLACX
|
Vanguard Large-Cap Index
|
Large Blend
|
0.91%
|
5.69%
|
7.14%
|
6.82%
|
7.46%
|
16.65%
|
-1.10%
|
|
VEIPX
|
Vanguard Equity Income
|
Large Value
|
0.90%
|
4.55%
|
6.12%
|
5.95%
|
5.06%
|
9.41%
|
-1.07%
|
|
VMCAX
|
Tax-Managed Cap Apprec.
|
Large Blend
|
0.90%
|
6.08%
|
7.46%
|
7.59%
|
8.00%
|
17.75%
|
-1.17%
|
|
VDEQX
|
Diversified Equity
|
Large Blend
|
0.85%
|
5.58%
|
7.10%
|
7.63%
|
7.99%
|
18.64%
|
-1.25%
|
|
VWELX
|
Vanguard Wellington
|
Moderate Allocation
|
0.78%
|
3.70%
|
4.80%
|
4.77%
|
5.36%
|
11.21%
|
-0.82%
|
|
VTSMX
|
Vanguard Total Stock Fund
|
Large Blend
|
0.75%
|
5.45%
|
6.87%
|
6.84%
|
7.39%
|
16.73%
|
-1.14%
|
|
VMRGX
|
Vanguard Morgan Growth
|
Large Growth
|
0.56%
|
5.58%
|
7.39%
|
6.96%
|
7.57%
|
17.94%
|
-1.34%
|
|
VQNPX
|
Vanguard G & I
|
Large Blend
|
0.47%
|
4.23%
|
6.48%
|
6.42%
|
6.85%
|
16.21%
|
-1.22%
|
|
VGSTX
|
Vanguard STAR
|
Moderate Allocation
|
0.41%
|
3.44%
|
4.28%
|
4.95%
|
5.29%
|
12.03%
|
-0.69%
|
|
VIGRX
|
Growth Index Trust Fund
|
Large Growth
|
0.36%
|
5.55%
|
6.47%
|
6.77%
|
6.71%
|
16.34%
|
-1.14%
|
|
VISGX
|
Small-Cap Growth Index Fund
|
Small Growth
|
0.34%
|
5.94%
|
7.95%
|
10.92%
|
9.94%
|
22.67%
|
-1.87%
|
|
VBINX
|
Vanguard Balanced Index
|
Moderate Allocation
|
0.28%
|
3.05%
|
3.88%
|
4.41%
|
4.71%
|
10.89%
|
-0.73%
|
|
VPCCX
|
PRIMECAP Core Fd
|
Large Blend
|
0.07%
|
6.84%
|
7.34%
|
7.92%
|
7.21%
|
15.45%
|
-0.86%
|
|
VCVSX
|
Convertible Securities
|
Convertibles
|
0.06%
|
2.81%
|
3.41%
|
4.96%
|
4.65%
|
10.29%
|
-0.68%
|
|
VWUSX
|
Vanguard U.S. Growth Fd
|
Large Growth
|
0.00%
|
4.41%
|
5.60%
|
5.77%
|
5.48%
|
13.69%
|
-1.42%
|
|
VWINX
|
Vanguard Wellesley Inc.
|
Conservative Allocation
|
0.00%
|
1.22%
|
1.95%
|
2.92%
|
3.10%
|
7.11%
|
-0.67%
|
|
VEXPX
|
Vanguard Explorer
|
Small Growth
|
-0.02%
|
4.66%
|
5.49%
|
7.72%
|
6.81%
|
16.63%
|
-1.50%
|
|
VIMSX
|
Vanguard Mid-Cap Index
|
Mid-Cap Blend
|
-0.13%
|
5.00%
|
6.14%
|
9.50%
|
8.57%
|
20.09%
|
-1.53%
|
|
VEXMX
|
Vanguard Extended Mkt
|
Mid-Cap Blend
|
-0.18%
|
4.23%
|
5.45%
|
8.27%
|
7.87%
|
19.43%
|
-1.77%
|
|
VTMSX
|
Tax-Managed Small-Cap
|
Small Blend
|
-0.21%
|
3.98%
|
6.17%
|
7.35%
|
7.31%
|
17.60%
|
-1.88%
|
|
VSEQX
|
Vanguard Strategic Equity
|
Mid-Cap Blend
|
-0.36%
|
3.97%
|
5.22%
|
8.12%
|
7.27%
|
17.67%
|
-1.57%
|
|
NAESX
|
Vanguard Small Cap Index
|
Small Blend
|
-0.38%
|
4.28%
|
5.57%
|
7.59%
|
7.49%
|
18.51%
|
-1.88%
|
|
VGEQX
|
Vanguard Growth Equity
|
Large Growth
|
-0.76%
|
4.80%
|
6.22%
|
6.41%
|
6.04%
|
15.59%
|
-1.59%
|
|
VISVX
|
Vanguard Small-Cap Value
|
Small Value
|
-1.05%
|
2.78%
|
3.45%
|
4.60%
|
5.31%
|
14.98%
|
-1.87%
|
1c. DOMESTIC FIDELITY MUTUAL
FUNDS: BUY
Most
likely you have a reason to follow and track Fidelity funds, be it for your
401k, IRA or brokerage account. The table below lists the most commonly held
ones, sorted by the 4wk momentum column:
|
Ticker
|
Fund Name
|
Orientation
|
4Wk
|
8Wk
|
12Wk
|
YTD
|
%M/A
|
Since 9/6/06
|
DD%
|
|
FLVCX
|
Fidelity Leveraged Stock Fd
|
Mid-Cap Blend
|
2.02%
|
8.85%
|
11.43%
|
16.02%
|
14.07%
|
24.80%
|
-1.68%
|
|
FCPGX
|
Fidelity Small Cap Growth
|
Small Growth
|
1.83%
|
7.01%
|
9.11%
|
13.11%
|
11.82%
|
24.44%
|
-1.71%
|
|
FDGFX
|
Fidelity Div. Growth
|
Large Blend
|
1.73%
|
6.30%
|
7.01%
|
6.48%
|
7.24%
|
15.45%
|
-0.68%
|
|
FDFFX
|
Fidelity Independence Fd
|
Large Growth
|
1.71%
|
7.54%
|
10.26%
|
9.81%
|
9.70%
|
18.68%
|
-2.09%
|
|
FBCVX
|
Fidelity Blue Chip
|
Large Value
|
1.59%
|
6.33%
|
8.13%
|
8.88%
|
9.29%
|
18.91%
|
-1.09%
|
|
FEQIX
|
Fidelity Equity Income
|
Large Value
|
1.52%
|
5.87%
|
7.08%
|
6.89%
|
7.78%
|
16.45%
|
-0.86%
|
|
FEQTX
|
Fidelity Equity Income II
|
Large Value
|
1.15%
|
5.51%
|
6.75%
|
6.72%
|
7.26%
|
15.90%
|
-0.74%
|
|
FDSCX
|
Fidelity Small Cap Independence
|
Small Growth
|
1.11%
|
5.61%
|
7.09%
|
9.75%
|
10.22%
|
21.98%
|
-1.33%
|
|
FDSVX
|
Fidelity Discovery Fd
|
Large Blend
|
1.07%
|
6.73%
|
8.62%
|
6.81%
|
7.41%
|
14.81%
|
-1.26%
|
|
FGRTX
|
Fidelity Gr. & Income II
|
Large Blend
|
1.04%
|
5.70%
|
7.40%
|
7.13%
|
7.31%
|
15.67%
|
-1.10%
|
|
FSMAX
|
Fidelity Spartan 500 Index-Advant.
|
Large Blend
|
1.04%
|
6.10%
|
7.64%
|
6.87%
|
7.68%
|
17.06%
|
-1.11%
|
|
FUSVX
|
Fid. U.S. Equity Index-Advant.
|
Large Blend
|
1.03%
|
6.10%
|
7.64%
|
6.87%
|
7.67%
|
17.05%
|
-1.12%
|
|
FDSSX
|
Fidelity Stock Selector
|
Large Blend
|
1.03%
|
5.84%
|
7.63%
|
7.44%
|
7.58%
|
16.30%
|
-1.14%
|
|
FSMKX
|
Fidelity Spartan 500 Index-Invest.
|
Large Blend
|
1.02%
|
6.01%
|
7.53%
|
6.76%
|
7.56%
|
16.77%
|
-1.10%
|
|
FUSEX
|
Fidelity Spartan Index
|
Large Blend
|
1.00%
|
5.89%
|
7.38%
|
6.63%
|
7.41%
|
16.42%
|
-1.07%
|
|
FFIDX
|
Fidelity Fund
|
Large Blend
|
0.99%
|
6.06%
|
8.32%
|
8.11%
|
8.10%
|
17.10%
|
-1.32%
|
|
FLPSX
|
Fidelity Low Price Stock
|
Small Value
|
0.96%
|
4.69%
|
6.52%
|
6.90%
|
7.95%
|
17.16%
|
-0.96%
|
|
FVDFX
|
Fidelity Value Discovery
|
Mid-Cap Blend
|
0.89%
|
6.37%
|
7.83%
|
9.57%
|
8.98%
|
17.46%
|
-1.50%
|
|
FLCSX
|
Fidelity Large Cap Stock Fd
|
Large Growth
|
0.88%
|
7.07%
|
8.14%
|
8.75%
|
8.98%
|
19.18%
|
-1.07%
|
|
FTQGX
|
Fidelity Focused Stock Fd
|
Large Growth
|
0.87%
|
7.24%
|
8.33%
|
10.65%
|
9.10%
|
16.39%
|
-1.63%
|
|
FDEQX
|
Fidelity Disciplined Equity
|
Large Blend
|
0.87%
|
6.14%
|
8.48%
|
8.95%
|
8.97%
|
18.89%
|
-1.33%
|
|
FSTVX
|
Fid. Total Mkt Index-Advant.
|
Large Blend
|
0.74%
|
5.65%
|
7.13%
|
7.13%
|
7.74%
|
17.61%
|
-1.21%
|
|
FSTMX
|
Fid. Total Mkt. Index-Invest.
|
Large Blend
|
0.73%
|
5.60%
|
7.05%
|
7.05%
|
7.65%
|
17.41%
|
-1.19%
|
|
FDGRX
|
Fidelity Growth
|
Large Growth
|
0.73%
|
7.21%
|
8.48%
|
6.99%
|
7.97%
|
19.13%
|
-1.89%
|
|
FCNTX
|
Fidelity Contrafund
|
Large Blend
|
0.72%
|
4.67%
|
6.41%
|
6.11%
|
6.44%
|
14.32%
|
-1.12%
|
|
FEXPX
|
Fidelity Export/Multinational
|
Large Blend
|
0.70%
|
4.97%
|
7.16%
|
7.54%
|
6.98%
|
14.65%
|
-1.16%
|
|
FDCAX
|
Fidelity Cap. Apprec.
|
Large Growth
|
0.59%
|
4.85%
|
6.14%
|
6.64%
|
6.78%
|
15.91%
|
-0.81%
|
|
FFNOX
|
Fidelity Four-in-One Index
|
Large Blend
|
0.51%
|
4.50%
|
6.07%
|
6.31%
|
6.89%
|
15.39%
|
-0.90%
|
|
FSLVX
|
Fidelity Large Cap Value Fd
|
Large Value
|
0.47%
|
4.71%
|
7.47%
|
7.74%
|
7.96%
|
16.45%
|
-1.66%
|
|
FGRIX
|
Fidelity Growth & Income
|
Large Cap
|
0.46%
|
4.20%
|
4.20%
|
4.05%
|
4.80%
|
11.29%
|
-0.61%
|
|
FSCRX
|
Fidelity Small Cap Retirement
|
Small Blend
|
0.45%
|
6.12%
|
7.01%
|
8.21%
|
7.45%
|
15.34%
|
-1.36%
|
|
FSLSX
|
Fidelity Value Strategy
|
Small Blend
|
0.28%
|
4.74%
|
6.16%
|
10.10%
|
9.18%
|
19.93%
|
-1.40%
|
|
FSLCX
|
Fidelity Small Cap Stock
|
Small Blend
|
0.25%
|
4.45%
|
6.10%
|
7.95%
|
7.52%
|
15.99%
|
-1.31%
|
|
FMILX
|
Fidelity New Millennium Fd
|
Mid-Cap Growth
|
0.21%
|
3.69%
|
4.99%
|
5.40%
|
6.20%
|
16.91%
|
-1.09%
|
|
FDVLX
|
Fidelity Value
|
Mid-Cap Value
|
0.18%
|
4.80%
|
5.60%
|
8.99%
|
8.36%
|
18.36%
|
-1.39%
|
|
FBGRX
|
Fidelity Blue Chip Growth
|
Large Growth
|
0.14%
|
5.89%
|
6.60%
|
5.25%
|
5.39%
|
12.30%
|
-1.28%
|
|
FMAGX
|
Fidelity Magellan
|
Large Blend
|
0.08%
|
4.78%
|
5.91%
|
6.42%
|
5.96%
|
12.42%
|
-1.05%
|
|
FCPVX
|
Fidelity Small Cap Value
|
Small Value
|
0.00%
|
4.65%
|
5.89%
|
7.65%
|
7.85%
|
19.13%
|
-1.82%
|
|
FMCSX
|
Fidelity Mid-Cap Stock Fd
|
Mid-Cap Growth
|
-0.23%
|
5.76%
|
7.51%
|
12.18%
|
9.86%
|
20.46%
|
-1.57%
|
|
FSEMX
|
Fid. Extended Mkt Index-Invest.
|
Mid-Cap Blend
|
-0.23%
|
3.99%
|
5.13%
|
7.74%
|
7.65%
|
19.10%
|
-1.66%
|
|
FSEVX
|
Fid. Extended Mkt Index-Advant.
|
Mid-Cap Blend
|
-0.23%
|
4.01%
|
5.16%
|
7.79%
|
7.69%
|
19.20%
|
-1.67%
|
|
FFTYX
|
Fidelity Fifty
|
Large Blend
|
-0.51%
|
4.03%
|
6.91%
|
8.31%
|
7.97%
|
18.07%
|
-1.40%
|
|
FNCMX
|
Fidelity Nasdaq Comp. Index
|
Large Growth
|
-0.57%
|
4.91%
|
5.54%
|
5.22%
|
5.60%
|
17.18%
|
-1.90%
|
|
FOCPX
|
Fidelity OTC
|
Large Growth
|
-0.60%
|
4.67%
|
6.63%
|
6.32%
|
6.71%
|
20.84%
|
-2.16%
|
|
FDEGX
|
Fidelity Aggr. Growth
|
Mid-Cap Growth
|
-0.61%
|
7.32%
|
7.86%
|
9.64%
|
9.55%
|
23.89%
|
-1.94%
|
|
FTRNX
|
Fidelity Trend Fund
|
Large Blend
|
-0.61%
|
4.54%
|
5.88%
|
4.51%
|
5.24%
|
12.99%
|
-1.63%
|
|
FSMVX
|
Fidelity Mid Cap Value
|
Mid-Cap Value
|
-0.83%
|
3.74%
|
6.08%
|
9.95%
|
8.51%
|
18.44%
|
-1.94%
|
|
FSMGX
|
Fidelity Mid Cap Growth
|
Mid-Cap Growth
|
-1.48%
|
3.10%
|
4.51%
|
4.94%
|
5.52%
|
17.62%
|
-2.24%
|
|
FSLGX
|
Fidelity Large Cap Growth
|
Large Growth
|
-1.49%
|
3.13%
|
4.68%
|
3.21%
|
4.61%
|
15.17%
|
-2.03%
|
1d. DOMESTIC T. ROWE PRICE MUTUAL
FUNDS: BUY
This new
addition to our StatSheet allows you to track T. Rowe Price’s funds
separately, in case you prefer having your account with them. Below are their
most commonly held funds:
|
Ticker
|
Fund Name
|
Orientation
|
4Wk
|
8Wk
|
12Wk
|
YTD
|
%M/A
|
Since 9/6/06
|
DD%
|
|
TRVLX
|
T. Rowe Price Value
|
Large Value
|
1.58%
|
7.37%
|
8.44%
|
8.40%
|
9.23%
|
19.74%
|
-0.88%
|
|
TRMCX
|
T. Rowe Price Mid-Cap Value
|
Mid-Cap Value
|
1.29%
|
5.57%
|
5.94%
|
8.09%
|
8.70%
|
19.44%
|
-0.96%
|
|
PRCOX
|
T. Rowe Price Cap. Opp.
|
Large Blend
|
1.28%
|
6.50%
|
7.88%
|
7.22%
|
8.03%
|
17.83%
|
-1.08%
|
|
PRDSX
|
T. Rowe Price Diversified Sm. Gr.
|
Small Growth
|
1.22%
|
6.20%
|
7.36%
|
8.77%
|
8.03%
|
17.10%
|
-1.87%
|
|
PRWCX
|
T. Rowe Price Cap. Apprec.
|
Moderate Allocation
|
1.07%
|
4.52%
|
5.17%
|
5.87%
|
6.48%
|
14.10%
|
-0.51%
|
|
PREIX
|
T. Rowe Price Equ. Index 500
|
Large Blend
|
0.98%
|
5.94%
|
7.41%
|
6.60%
|
7.41%
|
16.46%
|
-1.10%
|
|
PRGIX
|
T. Rowe Price G&I
|
Large Blend
|
0.94%
|
5.00%
|
5.39%
|
5.25%
|
6.02%
|
13.54%
|
-0.89%
|
|
PRSGX
|
T. Rowe Price Spectrum
|
Large Blend
|
0.86%
|
6.29%
|
7.86%
|
7.91%
|
8.77%
|
19.52%
|
-0.98%
|
|
POMIX
|
T. Rowe Price Tot. Equity Index
|
Large Blend
|
0.77%
|
5.67%
|
7.00%
|
7.07%
|
7.65%
|
17.53%
|
-1.22%
|
|
TRBCX
|
T. Rowe Blue Chip Growth
|
Large Growth
|
0.77%
|
7.55%
|
8.71%
|
7.99%
|
8.46%
|
18.40%
|
-1.16%
|
|
PRWAX
|
T. Rowe Price New America
|
Large Growth
|
0.60%
|
5.68%
|
6.40%
|
6.96%
|
6.86%
|
16.34%
|
-1.32%
|
|
PRGFX
|
T. Rowe Price Growth
|
Large Growth
|
0.40%
|
6.86%
|
8.01%
|
7.62%
|
8.37%
|
19.06%
|
-0.96%
|
|
PRDMX
|
T. Rowe Price Div. Mid-Cap Gr.
|
Mid-Cap Growth
|
0.27%
|
6.22%
|
6.68%
|
9.59%
|
8.68%
|
20.52%
|
-1.72%
|
|
PRNHX
|
T. Rowe Price New Horizons
|
Small Growth
|
0.13%
|
3.81%
|
5.03%
|
7.20%
|
6.67%
|
16.45%
|
-1.36%
|
|
PREFX
|
T. Rowe Price Tax-Efficient Multi
|
Mid-Cap Growth
|
0.00%
|
5.43%
|
5.77%
|
7.67%
|
7.40%
|
18.39%
|
-1.57%
|
|
PTEGX
|
T. Rowe Price Tax-Efficient Gr.
|
Large Growth
|
-0.18%
|
5.46%
|
5.56%
|
5.95%
|
6.12%
|
15.74%
|
-1.21%
|
|
PEXMX
|
T. Rowe Price Ext. Equ. Mkt. Ind.
|
Mid-Cap Blend
|
-0.33%
|
4.06%
|
5.20%
|
7.44%
|
7.63%
|
19.50%
|
-1.83%
|
1e. DOMESTIC RYDEX AND PROFUNDS: BUY
These
aggressive fund families are supporting the investing public by having the
most generous trading policies in the industry. If you don’t have an account
directly with them, check with your custodian about any fees that might
affect you.
Here are
the most commonly held funds:
|
Ticker
|
Fund Name
|
Orientation
|
4Wk
|
8Wk
|
12Wk
|
YTD
|
%M/A
|
Since 9/6/06
|
DD%
|
|
RYCVX
|
Rydex Dybamic Dow (200%)
|
Large Value
|
5.05%
|
17.73%
|
19.47%
|
14.36%
|
16.98%
|
34.93%
|
-1.73%
|
|
RYTNX
|
Rydex Titan 500 H (200%)
|
Large Blend
|
1.53%
|
11.34%
|
13.83%
|
10.74%
|
12.55%
|
29.87%
|
-2.28%
|
|
LVPIX
|
ProFunds Large Cap Value Inv
|
Large Value
|
1.30%
|
6.09%
|
7.58%
|
7.18%
|
8.26%
|
18.12%
|
-1.14%
|
|
RYBHX
|
Rydex Mid Cap Growth
|
Mid-Cap Growth
|
1.09%
|
6.13%
|
7.49%
|
10.39%
|
9.51%
|
22.22%
|
-1.46%
|
|
RYNAX
|
Rydex Nova
|
Large Blend
|
0.98%
|
7.73%
|
9.66%
|
8.23%
|
9.55%
|
22.70%
|
-1.72%
|
|
BLPIX
|
ProFunds Bull Inv
|
Large Blend
|
0.97%
|
5.98%
|
7.44%
|
6.37%
|
7.24%
|
16.25%
|
-1.14%
|
|
MGPIX
|
ProFunds Mid Cap Growth Inv
|
Mid-Cap Growth
|
0.90%
|
6.12%
|
7.88%
|
11.81%
|
9.63%
|
20.04%
|
-1.60%
|
|
RYSRX
|
Rydex Sector Rotation H
|
Mid-Cap Blend
|
0.78%
|
6.44%
|
7.55%
|
8.83%
|
9.40%
|
19.83%
|
-2.27%
|
|
LGPIX
|
ProFunds Large Cap Growth Inv
|
Large Growth
|
0.39%
|
5.46%
|
6.78%
|
5.08%
|
5.80%
|
13.56%
|
-1.11%
|
|
RYZAX
|
Rydex Large Cap Value
|
Large Value
|
0.17%
|
4.61%
|
6.04%
|
8.28%
|
8.34%
|
18.49%
|
-1.78%
|
|
RYMDX
|
Rydex Medius (150%)
|
Mid-Cap Blend
|
0.02%
|
7.08%
|
8.76%
|
14.07%
|
11.98%
|
27.31%
|
-2.71%
|
|
MDPIX
|
ProFunds Mid Cap Inv
|
Mid-Cap Blend
|
-0.04%
|
4.95%
|
6.29%
|
10.33%
|
8.62%
|
18.89%
|
-1.90%
|
|
SGPIX
|
ProFunds Small Cap Growth Inv
|
Small Growth
|
-0.17%
|
4.03%
|
6.75%
|
8.41%
|
7.69%
|
17.92%
|
-1.90%
|
|
RYQMX
|
Rydex Core Equity H
|
Mid-Cap Blend
|
-0.24%
|
3.89%
|
5.18%
|
5.34%
|
6.04%
|
15.36%
|
-1.31%
|
|
RYWAX
|
Rydex Small Cap Growth
|
Small Growth
|
-0.35%
|
2.63%
|
5.31%
|
5.66%
|
6.09%
|
17.56%
|
-2.08%
|
|
RYAWX
|
Rydex Large Cap Growth
|
Large Growth
|
-0.38%
|
5.18%
|
6.04%
|
6.87%
|
6.29%
|
14.81%
|
-1.11%
|
|
SVPIX
|
ProFunds Small Cap Value Inv
|
Small Value
|
-0.45%
|
3.61%
|
5.02%
|
5.54%
|
6.05%
|
15.91%
|
-1.81%
|
|
OTPIX
|
ProFunds OTC Inv
|
Large Growth
|
-0.81%
|
5.56%
|
6.55%
|
6.20%
|
5.97%
|
18.25%
|
-2.18%
|
|
MLPSX
|
ProFunds Mid Cap Value
|
Mid-Cap Value
|
-0.82%
|
3.67%
|
4.62%
|
8.60%
|
7.36%
|
16.95%
|
-2.08%
|
|
SLPIX
|
ProFunds Small Cap Inv
|
Small Blend
|
-0.87%
|
3.33%
|
4.18%
|
4.55%
|
5.16%
|
14.70%
|
-1.87%
|
|
RYAOX
|
Rydex OTC
|
Large Growth
|
-0.92%
|
5.31%
|
6.64%
|
6.07%
|
6.00%
|
18.43%
|
-2.06%
|
|
RYAVX
|
Rydex Mid Cap Value
|
Mid-Cap Value
|
-1.22%
|
3.11%
|
3.67%
|
8.16%
|
7.60%
|
19.69%
|
-2.08%
|
|
RYMKX
|
Rydex Mekros (150%)
|
Small Blend
|
-1.94%
|
4.28%
|
6.08%
|
6.22%
|
7.10%
|
22.10%
|
-2.92%
|
|
RYAZX
|
Rydex Small Cap Value
|
Small Value
|
-1.97%
|
1.94%
|
2.36%
|
3.92%
|
5.08%
|
15.90%
|
-2.26%
|
|
RYVYX
|
Rydex Velocity 100 H (200%)
|
Large Growth
|
-2.00%
|
10.43%
|
12.01%
|
10.29%
|
9.75%
|
33.40%
|
-4.23%
|
1f. DOMESTIC AMERICAN CENTURY
FUNDS: BUY
Here’s
another addition to my StatSheet featuring the most widely held funds of the
American Century family:
|
Ticker
|
Fund Name
|
Orientation
|
4Wk
|
8Wk
|
12Wk
|
YTD
|
%M/A
|
Since 9/6/06
|
DD%
|
|
BIGRX
|
American Century Income
|
Large Value
|
1.54%
|
6.72%
|
8.31%
|
7.23%
|
8.54%
|
18.64%
|
-0.87%
|
|
ACTIX
|
American Century Capital Val
|
Large Value
|
1.41%
|
6.11%
|
7.94%
|
6.23%
|
7.82%
|
16.52%
|
-1.05%
|
|
AAGPX
|
American AAdvantage Lg Cap Val.
|
Large Value
|
1.28%
|
5.94%
|
7.42%
|
7.20%
|
8.13%
|
17.33%
|
-1.03%
|
|
TWHIX
|
American Century Heritage Inv
|
Mid-Cap Growth
|
1.22%
|
8.00%
|
12.92%
|
17.19%
|
16.16%
|
32.27%
|
-1.88%
|
|
ACMVX
|
American Century Mid Cap Val.
|
Mid-Cap Value
|
1.12%
|
5.23%
|
6.18%
|
8.52%
|
8.76%
|
20.01%
|
-1.09%
|
|
AAFPX
|
American AAdvantage S&P 500
|
Large Blend
|
0.97%
|
5.54%
|
7.01%
|
6.14%
|
6.99%
|
15.86%
|
-1.14%
|
|
TWCVX
|
American Century Vista
Inv
|
Mid-Cap Growth
|
0.77%
|
7.68%
|
12.06%
|
14.46%
|
12.98%
|
24.04%
|
-1.88%
|
|
BEQGX
|
American Century Equity Gr.
|
Large Blend
|
0.69%
|
5.51%
|
7.98%
|
6.59%
|
7.40%
|
16.73%
|
-1.22%
|
|
AABPX
|
American AAdvantage Bal.
|
Moderate Allocation
|
0.60%
|
3.56%
|
4.27%
|
4.51%
|
5.22%
|
11.78%
|
-0.70%
|
|
TWEIX
|
American Century Equity Inc.
|
Mid-Cap Value
|
0.51%
|
3.06%
|
4.34%
|
4.06%
|
4.81%
|
10.81%
|
-0.76%
|
|
TWBIX
|
American Century Balanced Inv
|
Moderate Allocation
|
0.20%
|
2.81%
|
4.11%
|
3.95%
|
4.29%
|
9.86%
|
-0.77%
|
2. EXCHANGE TRADED FUNDS MASTER
LIST
As per request,
I have added this ETF Master list so that you can quickly compare various
ETFs without having to reference other tables. The ETFs listed in the table
(160) consist of the following orientations: Domestic, International,
Country, Sector and Specialty. Momentum figures for all ETFs are not adjusted
for dividends.
The
sorting order is by 4wk momentum.
|
Ticker
|
Fund Name
|
Orientation
|
4Wk
|
8Wk
|
12Wk
|
YTD
|
%M/A
|
DD%
|
|
CH
|
Chile Fund
|
Chile Stock
|
13.39%
|
23.71%
|
26.91%
|
27.66%
|
23.13%
|
0.00%
|
|
EWC
|
iShares Canada Index
|
Foreign Large Value
|
6.28%
|
12.32%
|
16.63%
|
16.63%
|
15.28%
|
-1.80%
|
|
EWW
|
iShares Mexico Index
|
Latin America Stock
|
5.97%
|
10.22%
|
20.06%
|
16.92%
|
19.52%
|
-2.46%
|
|
EWZ
|
iShares Brazil Index
|
Latin America Stock
|
5.06%
|
13.65%
|
23.90%
|
19.74%
|
22.48%
|
-4.92%
|
|
PXJ
|
Dynamic Oil & Gas Services
|
Oil & Gas
|
4.94%
|
14.13%
|
23.75%
|
21.88%
|
20.26%
|
-3.47%
|
|
IYZ
|
Down Jones US Telecom
|
Specialty-Commun.
|
4.83%
|
8.17%
|
10.23%
|
13.42%
|
13.33%
|
-0.80%
|
|
VOX
|
Vanguard Telecom Serv's
|
Specialty-Commun.
|
4.39%
|
7.36%
|
8.51%
|
11.48%
|
11.61%
|
-0.92%
|
|
IGE
|
Goldman Sachs Natural Res.
|
Specialty-Natural Res.
|
4.34%
|
9.85%
|
16.59%
|
14.69%
|
15.01%
|
-2.35%
|
|
ILF
|
iShares S&P 40 Latin America
|
Latin America Stock
|
4.22%
|
12.29%
|
21.67%
|
18.08%
|
20.21%
|
-4.34%
|
|
IXC
|
S&P Global Energy
|
Specialty-Natural Res.
|
4.21%
|
9.16%
|
17.30%
|
10.35%
|
12.64%
|
-1.93%
|
|
XLE
|
Energy Select Sector
|
Specialty-Natural Res.
|
3.98%
|
9.50%
|
17.60%
|
13.92%
|
14.70%
|
-2.32%
|
|
IYE
|
Dow Jones US Energy
|
Specialty-Natural Res.
|
3.65%
|
9.29%
|
17.56%
|
13.67%
|
14.82%
|
-2.29%
|
|
PXE
|
PowerShares Dyn. Energy Explor.
|
Energy
|
3.62%
|
8.71%
|
18.70%
|
18.51%
|
16.27%
|
-2.70%
|
|
VDE
|
Vanguard Energy VIPERS
|
Specialty-Natural Res.
|
3.61%
|
9.52%
|
17.78%
|
14.80%
|
15.12%
|
-2.27%
|
|
IXP
|
S&P Global Telecommunications
|
Specialty-Commun.
|
3.37%
|
7.57%
|
11.43%
|
11.80%
|
12.65%
|
-0.59%
|
|
PGJ
|
PowerShares Gldn Dragon
|
China
|
3.33%
|
8.90%
|
13.72%
|
7.86%
|
16.62%
|
-5.19%
|
|
EWY
|
iShares S. Korea Index
|
Pacific Asia/excl. Japan
|
3.24%
|
9.59%
|
15.83%
|
12.85%
|
12.96%
|
-1.97%
|
|
IYJ
|
Dow Jones US Industrial
|
Large Blend
|
2.92%
|
7.62%
|
8.69%
|
10.46%
|
10.05%
|
-0.81%
|
|
XLI
|
Industrial Select Sector
|
Large Value
|
2.85%
|
7.44%
|
8.48%
|
9.31%
|
8.77%
|
-0.80%
|
|
EWS
|
iShares Singapore Index
|
Pacific Asia/excl. Japan
|
2.83%
|
8.38%
|
18.19%
|
20.09%
|
19.56%
|
-2.18%
|
|
PPA
|
Aerospace & Defense
|
Aerospace/Defense
|
2.62%
|
7.16%
|
8.62%
|
11.95%
|
11.77%
|
-1.47%
|
|
DIA
|
DIA Diamond EFT
|
Large Value
|
2.48%
|
8.85%
|
9.76%
|
7.95%
|
8.98%
|
-0.84%
|
|
NY
|
NYSE 100 Index
|
Moderate Allocation
|
2.00%
|
6.79%
|
8.13%
|
6.26%
|
7.46%
|
-0.83%
|
|
JKF
|
Morningstar Large Value
|
Large Value
|
1.87%
|
6.35%
|
8.61%
|
6.78%
|
8.22%
|
-1.23%
|
|
OEF
|
S&P 100 Index
|
Large Growth
|
1.65%
|
6.91%
|
8.00%
|
5.42%
|
6.87%
|
-0.94%
|
|
EWG
|
iShares Germany Index
|
Europe Stock
|
1.59%
|
10.66%
|
17.22%
|
18.26%
|
17.88%
|
-1.21%
|
|
XLK
|
Technology Select
|
Specialty-Technology
|
1.59%
|
6.68%
|
8.16%
|
7.18%
|
7.33%
|
-2.16%
|
|
IVE
|
S&P 500/BARRA Value
|
Large Value
|
1.59%
|
6.54%
|
7.63%
|
7.45%
|
8.23%
|
-1.14%
|
|
PBS
|
Dynamic Media
|
Media
|
1.56%
|
5.79%
|
4.62%
|
5.01%
|
7.67%
|
-1.45%
|
|
EWP
|
iShares Spain Index
|
Europe Stock
|
1.52%
|
4.31%
|
9.80%
|
9.31%
|
10.80%
|
-1.51%
|
|
VTV
|
Vanguard Value
|
Large Value
|
1.51%
|
6.30%
|
7.85%
|
6.76%
|
7.90%
|
-1.17%
|
|
IYM
|
Dow Jones US Basic Mat's
|
Large Value
|
1.43%
|
6.76%
|
9.42%
|
16.22%
|
13.61%
|
-1.86%
|
|
EWU
|
iShares United Kingdom Index
|
Europe Stock
|
1.37%
|
4.53%
|
10.16%
|
7.43%
|
7.44%
|
-1.33%
|
|
JKD
|
Morningstar Large Core
|
Large Blend
|
1.31%
|
6.54%
|
6.54%
|
5.12%
|
6.13%
|
-1.19%
|
|
IWD
|
Russell 1000 Value
|
Large Value
|
1.30%
|
5.73%
|
7.10%
|
6.67%
|
7.63%
|
-1.23%
|
|
PEJ
|
PowerShares Dyn. Leisure & Ent.
|
Leisure & Entertainment
|
1.29%
|
3.86%
|
4.50%
|
4.79%
|
6.22%
|
-1.26%
|
|
ELV
|
DJ US LargeCap Value
|
Large Value
|
1.21%
|
6.13%
|
7.59%
|
6.53%
|
7.63%
|
-1.49%
|
|
XLB
|
Materials Select Sector
|
Large Blend
|
1.12%
|
4.87%
|
7.42%
|
14.36%
|
12.13%
|
-1.31%
|
|
DGT
|
DJ Global Titans
|
Large Blend
|
1.11%
|
5.63%
|
7.16%
|
3.84%
|
5.59%
|
-0.80%
|
|
NYC
|
NYSE Composite
|
Moderate Allocation
|
1.09%
|
6.08%
|
8.15%
|
7.43%
|
8.51%
|
-1.21%
|
|
PHO
|
Water Resources
|
Water Resources
|
1.08%
|
5.02%
|
6.27%
|
6.74%
|
7.53%
|
-2.04%
|
|
SPY
|
SPDRS
|
Large Blend
|
1.04%
|
6.23%
|
7.38%
|
6.60%
|
7.19%
|
-1.06%
|
|
IWW
|
Russell 3000 Value
|
Large Value
|
1.04%
|
5.41%
|
6.79%
|
6.31%
|
7.35%
|
-1.24%
|
|
IVV
|
S&P 500
|
Large Blend
|
1.01%
|
6.14%
|
7.29%
|
6.44%
|
7.11%
|
-1.11%
|
|
EWQ
|
iShares France Index
|
Europe Stock
|
0.98%
|
8.36%
|
13.56%
|
11.34%
|
12.22%
|
-1.85%
|
|
VV
|
Vanguard LargeCap
|
Large Blend
|
0.97%
|
6.10%
|
7.35%
|
6.99%
|
7.38%
|
-1.07%
|
|
IJK
|
S&P MidCap 400/BARRA
|
Mid-Cap Growth
|
0.96%
|
6.30%
|
7.58%
|
11.79%
|
9.65%
|
-1.50%
|
|
EWM
|
iShares Malaysia Index
|
Pacific Asia/excl. Japan
|
0.95%
|
8.53%
|
19.39%
|
28.57%
|
22.32%
|
-4.65%
|
|
IOO
|
S&P Global 100
|
World Stock
|
0.94%
|
6.75%
|
9.54%
|
6.88%
|
7.38%
|
-1.09%
|
|
IYG
|
Dow Jones US Financial Serv's
|
Specialty-Financial
|
0.86%
|
5.28%
|
4.16%
|
1.05%
|
3.55%
|
-1.71%
|
|
IWB
|
Russell 1000 Index
|
Large Blend
|
0.85%
|
5.97%
|
6.91%
|
6.88%
|
7.29%
|
-1.14%
|
|
IYY
|
Dow Jones US Tot. Market
|
Large Blend
|
0.84%
|
5.95%
|
6.98%
|
7.08%
|
7.39%
|
-1.26%
|
|
ISI
|
S&P 1500
|
Large Blend
|
0.73%
|
6.02%
|
7.12%
|
6.86%
|
7.24%
|
-1.36%
|
|
EWT
|
iShares Taiwan Index
|
Pacific Asia/excl. Japan
|
0.70%
|
2.66%
|
3.40%
|
-1.45%
|
3.10%
|
-3.83%
|
|
IWV
|
Russell 3000 Index
|
Large Blend
|
0.70%
|
5.75%
|
6.79%
|
6.67%
|
7.15%
|
-1.20%
|
|
XLV
|
Health Care Select SPDR
|
Specialty-Health
|
0.69%
|
8.85%
|
9.11%
|
9.41%
|
7.84%
|
-0.38%
|
|
VTI
|
Total Market VIPERs
|
Large Blend
|
0.69%
|
5.72%
|
6.82%
|
6.73%
|
7.16%
|
-1.25%
|
|
TMW
|
Wilshire 5000 Ttl Mkt
|
Large Blend
|
0.65%
|
5.77%
|
6.97%
|
6.73%
|
7.20%
|
-1.25%
|
|
VAW
|
Vanguard Materials VIPERS
|
Specialty-Natural Res.
|
0.62%
|
5.67%
|
8.57%
|
16.57%
|
13.63%
|
-1.66%
|
|
IVW
|
S&P 500/BARRA Growth
|
Large Growth
|
0.59%
|
6.06%
|
7.19%
|
5.70%
|
6.14%
|
-1.08%
|
|
FXI
|
iShares China 25 Index
|
Pacific Asia/excl. Japan
|
0.57%
|
5.34%
|
13.62%
|
-1.53%
|
12.54%
|
-5.78%
|
|
FEZ
|
Dow Jones Euro Stoxx 50
|
Europe Stock
|
0.55%
|
8.55%
|
13.64%
|
11.05%
|
12.38%
|
-1.70%
|
|
IWF
|
Russell 1000 Growth
|
Large Growth
|
0.54%
|
6.28%
|
6.89%
|
7.28%
|
7.06%
|
-1.02%
|
|
ELG
|
DJ US LargeCap Growth
|
Large Growth
|
0.53%
|
6.04%
|
6.45%
|
6.77%
|
6.77%
|
-1.25%
|
|
EZU
|
European Monetary Union Index
|
Europe Stock
|
0.48%
|
7.90%
|
14.04%
|
12.58%
|
13.05%
|
-1.20%
|
|
VHT
|
Vanguard Health Care
|
Specialty-Health
|
0.47%
|
8.05%
|
8.62%
|
9.34%
|
7.26%
|
-0.51%
|
|
XLF
|
Financial Select Sector
|
Specialty-Financial
|
0.46%
|
5.40%
|
4.28%
|
2.04%
|
4.14%
|
-1.24%
|
|
IYH
|
Dow Jones US Healthcare
|
Specialty-Health
|
0.43%
|
8.27%
|
8.35%
|
8.79%
|
7.21%
|
-0.63%
|
|
PWB
|
PowerShares Dyn. Large Cap Gr.
|
Large Growth
|
0.40%
|
5.42%
|
7.14%
|
5.86%
|
6.50%
|
-1.12%
|
|
VUG
|
Vanguard Growth
|
Large Growth
|
0.39%
|
5.87%
|
6.62%
|
6.90%
|
6.68%
|
-1.13%
|
|
IWZ
|
Russell 3000 Growth
|
Large Growth
|
0.35%
|
6.11%
|
6.77%
|
6.99%
|
6.93%
|
-1.19%
|
|
JKK
|
Morningstar SmallGrowth
|
Small Growth
|
0.34%
|
5.29%
|
7.37%
|
9.07%
|
8.19%
|
-2.01%
|
|
MTK
|
Morgan Stanley Technology
|
Specialty-Technology
|
0.32%
|
8.35%
|
7.44%
|
5.94%
|
7.37%
|
-2.27%
|
|
VBK
|
Vanguard SmallCap Growth
|
Small Growth
|
0.29%
|
5.92%
|
7.98%
|
11.00%
|
9.81%
|
-1.91%
|
|
IEV
|
S&P Europe 350 Index
|
Europe Stock
|
0.20%
|
7.02%
|
11.79%
|
10.13%
|
10.56%
|
-1.43%
|
|
DSG
|
DJ US SmallCap Growth
|
Small Growth
|
0.20%
|
5.33%
|
6.77%
|
9.74%
|
8.97%
|
-1.85%
|
|
EEM
|
iShares Emerging Mkts Index
|
Div. Emerging Mkts
|
0.19%
|
6.36%
|
13.36%
|
8.43%
|
11.91%
|
-2.73%
|
|
IGM
|
Goldman Sachs Tech. Index
|
Specialty-Technology
|
0.18%
|
6.24%
|
7.14%
|
5.91%
|
6.67%
|
-2.44%
|
|
MDY
|
MidCap SPDRS
|
Mid-Cap Blend
|
0.15%
|
5.23%
|
6.22%
|
10.80%
|
8.86%
|
-1.72%
|
|
IYW
|
Dow Jones US Technology
|
Specialty-Technology
|
0.14%
|
6.16%
|
6.87%
|
5.12%
|
5.74%
|
-2.52%
|
|
EFA
|
MSCI EAFE iShares Index Fd
|
Foreign Large Blend
|
0.14%
|
4.43%
|
8.60%
|
8.78%
|
8.86%
|
-1.25%
|
|
IXG
|
S&P Global Financial Sector
|
Specialty-Financial
|
0.13%
|
5.23%
|
6.96%
|
3.85%
|
6.06%
|
-1.13%
|
|
EFV
|
MSCI EAFE iShares Value Index
|
Foreign Large Blend
|
0.09%
|
4.29%
|
7.80%
|
7.33%
|
8.55%
|
-1.16%
|
|
VGT
|
Vanguard Info Technology
|
Specialty-Technolgy
|
0.09%
|
6.05%
|
6.97%
|
5.73%
|
6.08%
|
-2.63%
|
|
IJH
|
S&P MidCap 400
|
Mid-Cap Blend
|
0.08%
|
5.27%
|
6.02%
|
10.68%
|
8.74%
|
-1.85%
|
|
IYF
|
Dow Jones US Financial Sector
|
Specialty-Financial
|
0.06%
|
4.44%
|
3.06%
|
1.31%
|
3.29%
|
-2.17%
|
|
IXN
|
S&P Global Technology
|
Specialty-Technolgy
|
0.02%
|
5.86%
|
7.46%
|
3.74%
|
5.39%
|
-2.04%
|
|
VFH
|
Vanguard Financials
|
Specialty-Financial
|
0.02%
|
4.38%
|
3.45%
|
1.16%
|
3.47%
|
-1.98%
|
|
RSP
|
Rydex S&P Equal Weight
|
Large Blend
|
-0.02%
|
5.66%
|
7.01%
|
8.41%
|
8.03%
|
-1.29%
|
|
JKE
|
Morningstar Large Growth
|
Large Growth
|
-0.07%
|
5.32%
|
6.87%
|
6.85%
|
6.57%
|
-1.25%
|
|
PWC
|
Powershares Dynamic Mkt
|
Large Blend
|
-0.07%
|
4.91%
|
6.45%
|
6.85%
|
7.22%
|
-1.34%
|
|
JKI
|
Morningstar MidValue
|
Mid-Cap Value
|
-0.13%
|
4.61%
|
5.25%
|
8.41%
|
8.03%
|
-1.75%
|
|
IJT
|
S&P SmallCap 600/BARRA
|
Small Growth
|
-0.14%
|
4.25%
|
7.13%
|
8.78%
|
8.03%
|
-1.79%
|
|
IWP
|
Russell MidCap Growth
|
Mid-Cap Growth
|
-0.16%
|
5.89%
|
6.65%
|
9.80%
|
8.53%
|
-1.56%
|
|
VO
|
Vanguard Mid-Cap
|
Mid-Cap Blend
|
-0.16%
|
5.31%
|
6.38%
|
9.72%
|
8.26%
|
-1.56%
|
|
VXF
|
Extended Mkts VIPERs
|
Mid-Cap Blend
|
-0.17%
|
4.39%
|
5.59%
|
8.69%
|
7.57%
|
-1.75%
|
|
JKG
|
Morningstar MidCore
|
Mid-Cap Blend
|
-0.23%
|
5.11%
|
5.42%
|
8.95%
|
8.14%
|
-1.67%
|
|
DVY
|
DJ Select Dividend Index
|
Mid-Cap Value
|
-0.24%
|
3.65%
|
4.49%
|
4.89%
|
5.50%
|
-1.83%
|
|
IWR
|
Russell MidCap Index Fs
|
Mid-Cap Blend
|
-0.31%
|
5.05%
|
5.83%
|
9.21%
|
8.13%
|
-1.68%
|
|
SH
|
Short S&P 500 ProShares ETF
|
Bear Market
|
-0.32%
|
-4.57%
|
-6.17%
|
-4.09%
|
-5.67%
|
-12.26%
|
|
JKH
|
Morningstar MidGrowth
|
Mid-Cap Growth
|
-0.36%
|
6.01%
|
7.85%
|
11.64%
|
9.60%
|
-1.73%
|
|
IYK
|
Dow Jones US Cons. Non-Cycl.
|
Large Blend
|
-0.40%
|
4.33%
|
4.99%
|
5.41%
|
5.48%
|
-0.88%
|
|
VB
|
Vanguard SmallCap
|
Small Blend
|
-0.42%
|
4.46%
|
5.82%
|
8.05%
|
7.22%
|
-1.96%
|
|
TF
|
Thai Capital Fund
|
Pacific Asia/excl. Japan
|
-0.42%
|
13.29%
|
16.98%
|
5.71%
|
7.07%
|
-10.09%
|
|
VDC
|
Vanguard Consumer Staples
|
Large Blend
|
-0.43%
|
3.48%
|
5.49%
|
6.20%
|
5.27%
|
-0.82%
|
|
XLY
|
Consumer Discretionary Sec.
|
Large Blend
|
-0.45%
|
4.14%
|
3.86%
|
3.05%
|
4.88%
|
-1.64%
|
|
EWJ
|
iShares Japan Index
|
Japan Stock
|
-0.49%
|
-2.59%
|
-2.52%
|
0.77%
|
1.54%
|
-5.42%
|
|
EWK
|
iShares Belgium Index
|
Europe Stock
|
-0.50%
|
4.53%
|
10.71%
|
8.98%
|
9.50%
|
-2.04%
|
|
IJR
|
S&P Sm.Cap 600
|
Small Blend
|
-0.51%
|
3.92%
|
5.71%
|
6.94%
|
6.82%
|
-1.85%
|
|
IWS
|
Russell MidCap Value
|
Mid-Cap Value
|
-0.56%
|
4.26%
|
5.10%
|
8.70%
|
7.91%
|
-1.89%
|
|
IYC
|
Dow Jones US Consumer
|
Large Blend
|
-0.56%
|
3.17%
|
3.81%
|
4.63%
|
5.27%
|
-0.93%
|
|
IJS
|
S&P SmallCap 600/BARRA
|
Small Value
|
-0.57%
|
3.77%
|
4.92%
|
5.65%
|
5.97%
|
-1.81%
|
|
IWO
|
Russell 2000 Growth
|
Small Growth
|
-0.58%
|
4.38%
|
5.59%
|
6.85%
|
6.89%
|
-1.80%
|
|
QQQQ
|
Nasdaq 100 Trust Shares
|
Large Growth
|
-0.58%
|
5.94%
|
7.03%
|
6.95%
|
6.60%
|
-2.08%
|
|
PWO
|
Powershares Dynamic OTC
|
Mid-Cap Growth
|
-0.61%
|
5.22%
|
5.87%
|
6.21%
|
5.97%
|
-2.34%
|
|
XLP
|
Consumer Staples Select
|
Large Blend
|
-0.62%
|
3.43%
|
4.70%
|
4.94%
|
4.48%
|
-1.01%
|
|
JKJ
|
Morningstar SmallCore
|
Small Blend
|
-0.62%
|
4.13%
|
5.46%
|
6.09%
|
6.47%
|
-2.01%
|
|
EWD
|
iShares Sweden Index
|
Europe Stock
|
-0.62%
|
9.85%
|
18.78%
|
13.66%
|
17.16%
|
-1.87%
|
|
DSV
|
DJ US SmallCap Value
|
Small Value
|
-0.71%
|
3.71%
|
4.28%
|
6.10%
|
6.19%
|
-2.01%
|
|
EPP
|
iShares Pacific ex. Japan
|
Pacific Asia/excl. Japan
|
-0.72%
|
5.19%
|
11.82%
|
12.33%
|
11.85%
|
-3.45%
|
|
IJJ
|
S&P MidCap 400/BARRA
|
Mid-Cap Value
|
-0.79%
|
4.21%
|
4.86%
|
9.44%
|
7.88%
|
-2.18%
|
|
ONEQ
|
Fidelity Commonwealth
|
Large Growth
|
-0.80%
|
4.99%
|
5.49%
|
4.88%
|
5.41%
|
-1.94%
|
|
IXJ
|
S&P Global Healthcare
|
Specialty-Health
|
-0.81%
|
5.98%
|
6.95%
|
6.89%
|
5.18%
|
-1.51%
|
|
IYT
|
Dow Jones Transportation
|
Mid-Cap Blend
|
-0.84%
|
6.70%
|
5.44%
|
12.37%
|
7.39%
|
-2.07%
|
|
IGV
|
Goldman Sachs Software
|
Specialty-Technology
|
-0.87%
|
3.43%
|
5.94%
|
4.82%
|
4.49%
|
-3.03%
|
|
EWH
|
iShares Hong Kong Index
|
Pacific Asia/excl. Japan
|
-1.02%
|
2.79%
|
7.11%
|
3.56%
|
5.59%
|
-4.00%
|
|
IWM
|
Russell 2000
|
Small Blend
|
-1.05%
|
3.25%
|
4.32%
|
4.84%
|
5.44%
|
-1.81%
|
|
EWA
|
iShares Australia Index
|
Foreign Large Blend
|
-1.17%
|
5.48%
|
12.43%
|
14.86%
|
12.89%
|
-3.86%
|
|
IGN
|
Goldman Sachs Networking
|
Specialty-Technology
|
-1.21%
|
5.03%
|
2.30%
|
3.89%
|
4.58%
|
-2.79%
|
|
VBR
|
Vanguard SmallCap Value
|
Small Value
|
-1.22%
|
2.95%
|
3.64%
|
4.86%
|
4.67%
|
-1.98%
|
|
EWO
|
iShares Austria Index
|
Europe Stock
|
-1.24%
|
4.43%
|
14.30%
|
10.35%
|
13.58%
|
-2.01%
|
|
JKL
|
Morningstar Small Value
|
Small Value
|
-1.29%
|
3.61%
|
3.07%
|
4.10%
|
4.83%
|
-1.86%
|
|
FXE
|
CurrencyShares Euro Trust
|
World Bond
|
-1.30%
|
0.65%
|
2.00%
|
1.69%
|
2.86%
|
-1.72%
|
|
PJP
|
Dynamic Pharmaceuticals
|
Pharmaceuticals
|
-1.36%
|
9.06%
|
8.63%
|
7.98%
|
7.18%
|
-1.46%
|
|
EWI
|
iShares Italy Index
|
Europe Stock
|
-1.36%
|
5.70%
|
9.47%
|
7.23%
|
8.14%
|
-2.06%
|
|
PZI
|
Zacks Micro Cap
|
Micro Cap
|
-1.45%
|
1.10%
|
2.22%
|
3.02%
|
4.46%
|
-2.70%
|
|
DBC
|
DB Commodity Index
|
Specialty-Natural Resources
|
-1.56%
|
-1.94%
|
0.92%
|
2.77%
|
2.69%
|
-2.28%
|
|
IWN
|
Russell 2000 Value
|
Small Value
|
-1.60%
|
2.27%
|
3.18%
|
3.12%
|
4.17%
|
-1.83%
|
|
IFN
|
India Fund
|
India
|
-1.99%
|
4.31%
|
6.62%
|
-9.87%
|
-4.53%
|
-17.43%
|
|
UTH
|
Utilities HOLDRs
|
Specialty-Utilities
|
-2.17%
|
3.10%
|
7.61%
|
11.01%
|
10.15%
|
-3.90%
|
|
EWN
|
iShares Netherlands Index
|
Europe Stock
|
-2.21%
|
6.14%
|
16.18%
|
14.33%
|
12.81%
|
-3.25%
|
|
IDU
|
Dow Jones US Utilities
|
Specialty-Utilities
|
-2.40%
|
2.45%
|
6.38%
|
11.37%
|
9.85%
|
-4.08%
|
|
PSJ
|
Dynamic Software
|
Software
|
-2.41%
|
1.46%
|
3.64%
|
5.15%
|
4.15%
|
-2.70%
|
|
PXN
|
Lux Nanotech
|
Nanotechnology
|
-2.52%
|
1.28%
|
1.46%
|
0.99%
|
-0.41%
|
-5.90%
|
|
VPU
|
Vanguard Utilities VIPERS
|
Specialty-Utilities
|
-2.52%
|
2.30%
|
6.44%
|
11.74%
|
9.97%
|
-4.19%
|
|
EWL
|
iShares Switzerland Index
|
Europe Stock
|
-2.55%
|
4.21%
|
8.18%
|
7.27%
|
7.69%
|
-2.77%
|
|
XLU
|
Utilities Select Sector
|
Specialty-Utilities
|
-2.85%
|
2.07%
|
6.03%
|
11.57%
|
9.78%
|
-4.21%
|
|
IIH
|
Internet Infrastructure HOLDRs
|
Specialty-Technology
|
-2.88%
|
-1.56%
|
-2.88%
|
-7.51%
|
-5.64%
|
-12.93%
|
|
EZA
|
iShares South Africa Index
|
N/A
|
-3.00%
|
7.01%
|
13.77%
|
11.98%
|
15.26%
|
-5.29%
|
|
IIF
|
Morgan Stanley India Fund
|
India
|
-3.00%
|
1.44%
|
1.55%
|
-11.08%
|
-4.67%
|
-14.41%
|
|
PBE
|
Dyn. Biotechnology/Genome
|
Biotech & Genome
|
-3.05%
|
7.38%
|
8.60%
|
7.74%
|
5.08%
|
-3.39%
|
|
IAU
|
iShares Comex Gold
|
Specialty-Natural Res.
|
-3.11%
|
-1.37%
|
-1.67%
|
2.43%
|
2.49%
|
-5.49%
|
|
IBB
|
Nasdaq Biotechnology
|
Specialty-Health
|
-3.95%
|
7.01%
|
6.39%
|
3.23%
|
2.67%
|
-3.95%
|
|
IGW
|
Goldman Sachs Semiconductor
|
Specialty-Technology
|
-4.02%
|
5.19%
|
2.91%
|
3.64%
|
2.31%
|
-4.79%
|
|
PBW
|
WilderHill Clean Energy
|
Clean Energy
|
-5.32%
|
0.47%
|
4.44%
|
9.93%
|
5.57%
|
-5.56%
|
|
BBH
|
Merrill Lynch Biotech
|
Specialty-Health
|
-5.38%
|
1.65%
|
-0.67%
|
-3.22%
|
-3.76%
|
-9.70%
|
|
TKF
|
Turkish Investment Fund
|
Turkey
|
-6.25%
|
0.69%
|
3.48%
|
3.42%
|
0.69%
|
-14.90%
|
|
IYR
|
Dow Jones US Real Estate
|
Specialty-Real Estate
|
-7.56%
|
-4.61%
|
-7.98%
|
-3.36%
|
-3.92%
|
-14.98%
|
|
VNQ
|
Vanguard REIT Index
|
Specialty-Real Estate
|
-8.23%
|
-5.27%
|
-8.44%
|
-3.83%
|
-4.78%
|
-15.02%
|
|
RWR
|
Wilshire REIT Fund
|
Specialty-Real Estate
|
-8.38%
|
-5.47%
|
-8.88%
|
-3.85%
|
-4.81%
|
-15.41%
|
2a. DOMESTIC EXCHANGE TRADED FUNDS
(ETFs): BUY
ETFs are
an excellent alternative to No Load Mutual Funds. They are a valid choice to
high mutual fund management fees, restrictive trading and redemption charges,
which have been a problem for years.
If you’re
not sure how to use ETFs please read my FREE article about their pros and
cons, which you may view anytime at:
http://www.successful-investment.com/articles24.htm
All the
same Buy and Sell rules apply for domestic ETFs as they do for domestic equity mutual funds in
section 1.
|
Ticker
|
Fund Name
|
Orientation
|
4Wk
|
8Wk
|
12Wk
|
YTD
|
%M/A
|
Since 9/6/06
|
DD%
|
|
IYJ
|
Dow Jones US Industrial
|
Large Blend
|
2.92%
|
7.62%
|
8.69%
|
10.46%
|
10.05%
|
20.84%
|
-0.81%
|
|
XLI
|
Industrial Select Sector
|
Large Value
|
2.85%
|
7.44%
|
8.48%
|
9.31%
|
8.77%
|
18.81%
|
-0.80%
|
|
DIA
|
DIA Diamond EFT
|
Large Value
|
2.48%
|
8.85%
|
9.76%
|
7.95%
|
8.98%
|
17.66%
|
-0.84%
|
|
NY
|
NYSE 100 Index
|
Moderate Allocation
|
2.00%
|
6.79%
|
8.13%
|
6.26%
|
7.46%
|
14.86%
|
-0.83%
|
|
JKF
|
Morningstar Large Value
|
Large Value
|
1.87%
|
6.35%
|
8.61%
|
6.78%
|
8.22%
|
15.30%
|
-1.23%
|
|
OEF
|
S&P 100 Index
|
Large Growth
|
1.65%
|
6.91%
|
8.00%
|
5.42%
|
6.87%
|
15.45%
|
-0.94%
|
|
IVE
|
S&P 500/BARRA Value
|
Large Value
|
1.59%
|
6.54%
|
7.63%
|
7.45%
|
8.23%
|
17.58%
|
-1.14%
|
|
VTV
|
Vanguard Value
|
Large Value
|
1.51%
|
6.30%
|
7.85%
|
6.76%
|
7.90%
|
16.17%
|
-1.17%
|
|
IYM
|
Dow Jones US Basic Mat's
|
Large Value
|
1.43%
|
6.76%
|
9.42%
|
16.22%
|
13.61%
|
26.07%
|
-1.86%
|
|
JKD
|
Morningstar Large Core
|
Large Blend
|
1.31%
|
6.54%
|
6.54%
|
5.12%
|
6.13%
|
15.01%
|
-1.19%
|
|
IWD
|
Russell 1000 Value
|
Large Value
|
1.30%
|
5.73%
|
7.10%
|
6.67%
|
7.63%
|
15.99%
|
-1.23%
|
|
ELV
|
DJ US LargeCap Value
|
Large Value
|
1.21%
|
6.13%
|
7.59%
|
6.53%
|
7.63%
|
16.16%
|
-1.49%
|
|
XLB
|
Materials Select Sector
|
Large Blend
|
1.12%
|
4.87%
|
7.42%
|
14.36%
|
12.13%
|
24.48%
|
-1.31%
|
|
DGT
|
DJ Global Titans
|
Large Blend
|
1.11%
|
5.63%
|
7.16%
|
3.84%
|
5.59%
|
11.66%
|
-0.80%
|
|
NYC
|
NYSE Composite
|
Moderate Allocation
|
1.09%
|
6.08%
|
8.15%
|
7.43%
|
8.51%
|
17.40%
|
-1.21%
|
|
SPY
|
SPDRS
|
Large Blend
|
1.04%
|
6.23%
|
7.38%
|
6.60%
|
7.19%
|
15.67%
|
-1.06%
|
|
IWW
|
Russell 3000 Value
|
Large Value
|
1.04%
|
5.41%
|
6.79%
|
6.31%
|
7.35%
|
16.09%
|
-1.24%
|
|
IVV
|
S&P 500
|
Large Blend
|
1.01%
|
6.14%
|
7.29%
|
6.44%
|
7.11%
|
15.59%
|
-1.11%
|
|
VV
|
Vanguard LargeCap
|
Large Blend
|
0.97%
|
6.10%
|
7.35%
|
6.99%
|
7.38%
|
16.39%
|
-1.07%
|
|
IJK
|
S&P MidCap 400/BARRA
|
Mid-Cap Growth
|
0.96%
|
6.30%
|
7.58%
|
11.79%
|
9.65%
|
20.58%
|
-1.50%
|
|
IWB
|
Russell 1000 Index
|
Large Blend
|
0.85%
|
5.97%
|
6.91%
|
6.88%
|
7.29%
|
16.33%
|
-1.14%
|
|
IYY
|
Dow Jones US Tot. Market
|
Large Blend
|
0.84%
|
5.95%
|
6.98%
|
7.08%
|
7.39%
|
16.51%
|
-1.26%
|
|
ISI
|
S&P 1500
|
Large Blend
|
0.73%
|
6.02%
|
7.12%
|
6.86%
|
7.24%
|
15.95%
|
-1.36%
|
|
IWV
|
Russell 3000 Index
|
Large Blend
|
0.70%
|
5.75%
|
6.79%
|
6.67%
|
7.15%
|
16.25%
|
-1.20%
|
|
VTI
|
Total Market VIPERs
|
Large Blend
|
0.69%
|
5.72%
|
6.82%
|
6.73%
|
7.16%
|
16.30%
|
-1.25%
|
|
TMW
|
Wilshire 5000 Ttl Mkt
|
Large Blend
|
0.65%
|
5.77%
|
6.97%
|
6.73%
|
7.20%
|
16.21%
|
-1.25%
|
|
IVW
|
S&P 500/BARRA Growth
|
Large Growth
|
0.59%
|
6.06%
|
7.19%
|
5.70%
|
6.14%
|
13.99%
|
-1.08%
|
|
IWF
|
Russell 1000 Growth
|
Large Growth
|
0.54%
|
6.28%
|
6.89%
|
7.28%
|
7.06%
|
16.39%
|
-1.02%
|
|
ELG
|
DJ US LargeCap Growth
|
Large Growth
|
0.53%
|
6.04%
|
6.45%
|
6.77%
|
6.77%
|
16.09%
|
-1.25%
|
|
PWB
|
PowerShares Dyn. Large Cap Gr.
|
Large Growth
|
0.40%
|
5.42%
|
7.14%
|
5.86%
|
6.50%
|
15.91%
|
-1.12%
|
|
VUG
|
Vanguard Growth
|
Large Growth
|
0.39%
|
5.87%
|
6.62%
|
6.90%
|
6.68%
|
16.28%
|
-1.13%
|
|
IWZ
|
Russell 3000 Growth
|
Large Growth
|
0.35%
|
6.11%
|
6.77%
|
6.99%
|
6.93%
|
16.45%
|
-1.19%
|
|
JKK
|
Morningstar SmallGrowth
|
Small Growth
|
0.34%
|
5.29%
|
7.37%
|
9.07%
|
8.19%
|
19.05%
|
-2.01%
|
|
VBK
|
Vanguard SmallCap Growth
|
Small Growth
|
0.29%
|
5.92%
|
7.98%
|
11.00%
|
9.81%
|
22.41%
|
-1.91%
|
|
DSG
|
DJ US SmallCap Growth
|
Small Growth
|
0.20%
|
5.33%
|
6.77%
|
9.74%
|
8.97%
|
21.22%
|
-1.85%
|
|
MDY
|
MidCap SPDRS
|
Mid-Cap Blend
|
0.15%
|
5.23%
|
6.22%
|
10.80%
|
8.86%
|
19.16%
|
-1.72%
|
|
IJH
|
S&P MidCap 400
|
Mid-Cap Blend
|
0.08%
|
5.27%
|
6.02%
|
10.68%
|
8.74%
|
19.05%
|
-1.85%
|
|
RSP
|
Rydex S&P Equal Weight
|
Large Blend
|
-0.02%
|
5.66%
|
7.01%
|
8.41%
|
8.03%
|
18.69%
|
-1.29%
|
|
JKE
|
Morningstar Large Growth
|
Large Growth
|
-0.07%
|
5.32%
|
6.87%
|
6.85%
|
6.57%
|
15.81%
|
-1.25%
|
|
PWC
|
Powershares Dynamic Mkt
|
Large Blend
|
-0.07%
|
4.91%
|
6.45%
|
6.85%
|
7.22%
|
16.87%
|
-1.34%
|
|
JKI
|
Morningstar MidValue
|
Mid-Cap Value
|
-0.13%
|
4.61%
|
5.25%
|
8.41%
|
8.03%
|
18.77%
|
-1.75%
|
|
IJT
|
S&P SmallCap 600/BARRA
|
Small Growth
|
-0.14%
|
4.25%
|
7.13%
|
8.78%
|
8.03%
|
18.40%
|
-1.79%
|
|
IWP
|
Russell MidCap Growth
|
Mid-Cap Growth
|
-0.16%
|
5.89%
|
6.65%
|
9.80%
|
8.53%
|
20.50%
|
-1.56%
|
|
VO
|
Vanguard Mid-Cap
|
Mid-Cap Blend
|
-0.16%
|
5.31%
|
6.38%
|
9.72%
|
8.26%
|
19.23%
|
-1.56%
|
|
VXF
|
Extended Mkts VIPERs
|
Mid-Cap Blend
|
-0.17%
|
4.39%
|
5.59%
|
8.69%
|
7.57%
|
18.62%
|
-1.75%
|
|
JKG
|
Morningstar MidCore
|
Mid-Cap Blend
|
-0.23%
|
5.11%
|
5.42%
|
8.95%
|
8.14%
|
19.91%
|
-1.67%
|
|
DVY
|
DJ Select Dividend Index
|
Mid-Cap Value
|
-0.24%
|
3.65%
|
4.49%
|
4.89%
|
5.50%
|
12.70%
|
-1.83%
|
|
IWR
|
Russell MidCap Index Fs
|
Mid-Cap Blend
|
-0.31%
|
5.05%
|
5.83%
|
9.21%
|
8.13%
|
19.43%
|
-1.68%
|
|
JKH
|
Morningstar MidGrowth
|
Mid-Cap Growth
|
-0.36%
|
6.01%
|
7.85%
|
11.64%
|
9.60%
|
21.82%
|
-1.73%
|
|
IYK
|
Dow Jones US Cons. Non-Cycl.
|
Large Blend
|
-0.40%
|
4.33%
|
4.99%
|
5.41%
|
5.48%
|
12.08%
|
-0.88%
|
|
VB
|
Vanguard SmallCap
|
Small Blend
|
-0.42%
|
4.46%
|
5.82%
|
8.05%
|
7.22%
|
17.86%
|
-1.96%
|
|
VDC
|
Vanguard Consumer Staples
|
Large Blend
|
-0.43%
|
3.48%
|
5.49%
|
6.20%
|
5.27%
|
9.43%
|
-0.82%
|
|
XLY
|
Consumer Discretionary Sec.
|
Large Blend
|
-0.45%
|
4.14%
|
3.86%
|
3.05%
|
4.88%
|
20.23%
|
-1.64%
|
|
IJR
|
S&P Sm.Cap 600
|
Small Blend
|
-0.51%
|
3.92%
|
5.71%
|
6.94%
|
6.82%
|
16.88%
|
-1.85%
|
|
IWS
|
Russell MidCap Value
|
Mid-Cap Value
|
-0.56%
|
4.26%
|
5.10%
|
8.70%
|
7.91%
|
18.52%
|
-1.89%
|
|
IYC
|
Dow Jones US Consumer
|
Large Blend
|
-0.56%
|
3.17%
|
3.81%
|
4.63%
|
5.27%
|
17.96%
|
-0.93%
|
|
IJS
|
S&P SmallCap 600/BARRA
|
Small Value
|
-0.57%
|
3.77%
|
4.92%
|
5.65%
|
5.97%
|
15.92%
|
-1.81%
|
|
IWO
|
Russell 2000 Growth
|
Small Growth
|
-0.58%
|
4.38%
|
5.59%
|
6.85%
|
6.89%
|
18.03%
|
-1.80%
|
|
QQQQ
|
Nasdaq 100 Trust Shares
|
Large Growth
|
-0.58%
|
5.94%
|
7.03%
|
6.95%
|
6.60%
|
19.37%
|
-2.08%
|
|
PWO
|
Powershares Dynamic OTC
|
Mid-Cap Growth
|
-0.61%
|
5.22%
|
5.87%
|
6.21%
|
5.97%
|
16.31%
|
-2.34%
|
|
XLP
|
Consumer Staples Select
|
Large Blend
|
-0.62%
|
3.43%
|
4.70%
|
4.94%
|
4.48%
|
7.49%
|
-1.01%
|
|
JKJ
|
Morningstar SmallCore
|
Small Blend
|
-0.62%
|
4.13%
|
5.46%
|
6.09%
|
6.47%
|
16.79%
|
-2.01%
|
|
DSV
|
DJ US SmallCap Value
|
Small Value
|
-0.71%
|
3.71%
|
4.28%
|
6.10%
|
6.19%
|
15.02%
|
-2.01%
|
|
IJJ
|
S&P MidCap 400/BARRA
|
Mid-Cap Value
|
-0.79%
|
4.21%
|
4.86%
|
9.44%
|
7.88%
|
18.11%
|
-2.18%
|
|
ONEQ
|
Fidelity Commonwealth
|
Large Growth
|
-0.80%
|
4.99%
|
5.49%
|
4.88%
|
5.41%
|
16.96%
|
-1.94%
|
|
IYT
|
Dow Jones Transportation
|
Mid-Cap Blend
|
-0.84%
|
6.70%
|
5.44%
|
12.37%
|
7.39%
|
21.21%
|
-2.07%
|
|
IWM
|
Russell 2000
|
Small Blend
|
-1.05%
|
3.25%
|
4.32%
|
4.84%
|
5.44%
|
15.47%
|
-1.81%
|
|
VBR
|
Vanguard SmallCap Value
|
Small Value
|
-1.22%
|
2.95%
|
3.64%
|
4.86%
|
4.67%
|
13.63%
|
-1.98%
|
|
JKL
|
Morningstar Small Value
|
Small Value
|
-1.29%
|
3.61%
|
3.07%
|
4.10%
|
4.83%
|
13.88%
|
-1.86%
|
3. INTERNATIONAL EQUITY MUTUAL
FUNDS: BUY
— since 8/17/2006
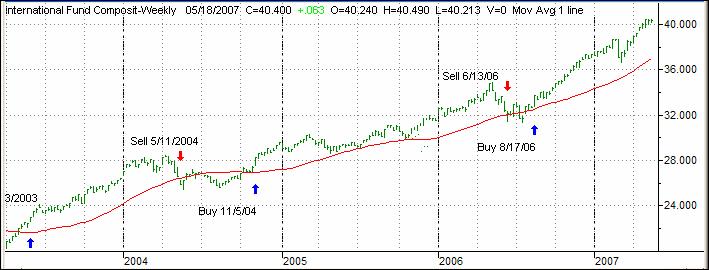
The
International Index (green) recovered after the Sell signal on 6/13/06, broke
above its trend line (red), back below it and has currently moved above it by
+9.57%. A Buy signal for broadly based
international funds/ETFs (not Country funds) was triggered effective 8/17/06, and I originally
committed an average of about 15% of portfolio value to this arena and, after
a gain of 5%, I added another 15%.
I will
use a 7% trailing sell stop on all of my positions.
The
listings below represent some of my choices out of the 95 international funds
I track. Please note that I have added Vanguard, Fidelity, T. Rowe Price,
Rydex/ProFunds and American Century funds. They are sorted by 4wk
performance:
|
Ticker
|
Fund Name
|
Orientation
|
4Wk
|
8Wk
|
12Wk
|
YTD
|
%M/A
|
Since 8/17/06
|
DD%
|
|
ODMAX
|
*Oppenheimer Devel. Mkts (2%/30)
|
Diversified Emerging Mkts
|
1.49%
|
7.85%
|
11.54%
|
9.38%
|
12.80%
|
30.63%
|
-1.56%
|
|
FISMX
|
Fidelity Intern. Small Cap
|
Broadly Diversified
|
1.48%
|
4.99%
|
7.42%
|
9.01%
|
9.38%
|
16.86%
|
-0.66%
|
|
VEIEX
|
Vanguard Emerging Mkts Index
|
Div. Emerging Markets
|
1.46%
|
7.85%
|
13.22%
|
9.99%
|
13.46%
|
30.91%
|
-1.98%
|
|
UEPIX
|
ProFunds Europe 30 Inv
|
Europe Stock
|
1.40%
|
7.51%
|
11.64%
|
8.60%
|
9.57%
|
20.00%
|
-0.83%
|
|
VHGEX
|
Vanguard Global Equity
|
World Stock
|
1.30%
|
6.18%
|
9.12%
|
10.02%
|
10.42%
|
23.61%
|
-1.09%
|
|
GTIIX
|
Glenmede Institutional International
|
Foreign Large Value
|
1.22%
|
4.60%
|
6.96%
|
6.15%
|
7.72%
|
18.18%
|
-0.86%
|
|
PRGSX
|
T. Rowe Price Global
|
World Stock
|
1.07%
|
6.52%
|
8.14%
|
9.61%
|
10.80%
|
29.02%
|
-1.08%
|
|
FIGRX
|
Fidelity Intern. Discovery
|
Broadly Diversified
|
0.99%
|
5.88%
|
9.79%
|
8.75%
|
10.41%
|
23.11%
|
-0.97%
|
|
IOO
|
S&P Global 100
|
World Stock
|
0.94%
|
6.75%
|
9.54%
|
6.88%
|
7.38%
|
17.85%
|
-1.09%
|
|
VTRIX
|
Vanguard Intern. Value Fd.
|
Foreign Large Blend
|
0.92%
|
4.78%
|
7.94%
|
8.04%
|
9.22%
|
21.81%
|
-0.98%
|
|
PSILX
|
T. Rowe Price Spectrum Intern.
|
Foreign Large Blend
|
0.76%
|
5.10%
|
8.56%
|
7.74%
|
9.88%
|
25.08%
|
-0.88%
|
|
PRITX
|
T. Rowe Price International
|
Foreign Large Growth
|
0.72%
|
4.76%
|
8.05%
|
6.93%
|
8.92%
|
22.19%
|
-0.96%
|
|
CIBFX
|
American Fds Capital
|
World Allocation
|
0.67%
|
4.00%
|
6.96%
|
6.33%
|
7.39%
|
17.46%
|
-0.69%
|
|
BTEQX
|
Scudder International Equity Invm
|
Foreign Large Blend
|
0.66%
|
5.63%
|
10.07%
|
8.86%
|
10.27%
|
23.93%
|
-1.08%
|
|
PRIDX
|
T. Rowe Price International Disc.
|
Foreign Small/Mid Growth
|
0.64%
|
5.54%
|
8.93%
|
10.23%
|
11.71%
|
29.29%
|
-0.70%
|
|
PHITX
|
*Phoenix-Aberdeen International A
|
Foreign Large Blend
|
0.63%
|
5.27%
|
8.19%
|
8.34%
|
9.04%
|
20.42%
|
-1.36%
|
|
FOSFX
|
Fidelity Overseas Fund
|
Broadly Diversified
|
0.60%
|
6.21%
|
10.18%
|
9.36%
|
10.64%
|
22.43%
|
-0.96%
|
|
FDIVX
|
Fidelity Diversified Int.
|
Foreign Stock
|
0.58%
|
5.56%
|
9.10%
|
8.47%
|
9.63%
|
21.68%
|
-0.95%
|
|
FWWFX
|
Fidelity Worldwide Fund
|
Broadly Diversified
|
0.58%
|
4.92%
|
7.69%
|
7.92%
|
8.72%
|
21.12%
|
-1.03%
|
|
FEZ
|
Dow Jones Euro Stoxx 50
|
Europe Stock
|
0.55%
|
8.55%
|
13.64%
|
11.05%
|
12.38%
|
27.97%
|
-1.70%
|
|
VWIGX
|
Vanguard International Growth
|
Foreign Large Blend
|
0.54%
|
5.38%
|
8.75%
|
8.23%
|
9.45%
|
21.88%
|
-1.07%
|
|
VGTSX
|
Vanguard Intern. Stock Index
|
Forein Large Blend
|
0.50%
|
4.92%
|
9.05%
|
8.99%
|
10.17%
|
24.08%
|
-1.03%
|
|
EZU
|
European Monetary Union Index
|
Europe Stock
|
0.48%
|
7.90%
|
14.04%
|
12.58%
|
13.05%
|
31.19%
|
-1.20%
|
|
PRESX
|
T. Rowe Price European
|
Europe Stock
|
0.48%
|
4.78%
|
8.78%
|
8.38%
|
9.94%
|
25.79%
|
-0.60%
|
|
FSCOX
|
Fidelity Intern. Sm. Cap Opp.
|
Broadly Diversified
|
0.46%
|
3.99%
|
7.85%
|
10.51%
|
12.32%
|
33.21%
|
-1.30%
|
|
VEURX
|
Vanguard Europe Stock Index
|
Europe Stock
|
0.45%
|
6.36%
|
11.46%
|
10.62%
|
11.46%
|
27.29%
|
-0.98%
|
|
FSIVX
|
Fidelity Spartan Intern. Index-Adv.
|
Broadly Diversified
|
0.40%
|
4.62%
|
8.46%
|
8.82%
|
9.89%
|
23.48%
|
-1.02%
|
|
FSIIX
|
Fidelity Spartan Intern. Index-Inv.
|
Broadly Diversified
|
0.40%
|
4.57%
|
8.35%
|
8.68%
|
9.74%
|
23.07%
|
-1.00%
|
|
FIVFX
|
Fidelity Aggress. International
|
Broadly Diversified
|
0.30%
|
3.35%
|
5.33%
|
7.03%
|
8.03%
|
18.37%
|
-1.11%
|
|
VINEX
|
Vanguard Intern. Explorer
|
Foreign Small/Mid Growth
|
0.29%
|
4.04%
|
7.55%
|
9.57%
|
10.46%
|
27.49%
|
-0.99%
|
|
VDMIX
|
Vanguard Developed Mkts Index
|
Foreign Large Blend
|
0.28%
|
4.33%
|
8.24%
|
8.81%
|
9.54%
|
22.77%
|
-1.16%
|
|
VTMGX
|
Vanguard Tax-Managed Intern.
|
Forein Large Blend
|
0.25%
|
4.36%
|
8.26%
|
8.84%
|
9.55%
|
22.90%
|
-1.16%
|
|
IEV
|
S&P Europe 350 Index
|
Europe Stock
|
0.20%
|
7.02%
|
11.79%
|
10.13%
|
10.56%
|
24.85%
|
-1.43%
|
|
EFA
|
MSCI EAFE iShares Index Fd
|
Foreign Large Blend
|
0.14%
|
4.43%
|
8.60%
|
8.78%
|
8.86%
|
21.29%
|
-1.25%
|
|
EFV
|
MSCI EAFE iShares Value Index
|
Foreign Large Blend
|
0.09%
|
4.29%
|
7.80%
|
7.33%
|
8.55%
|
21.84%
|
-1.16%
|
|
RYEUX
|
Rydex Large Cap Europe H
|
Europe Stock
|
-0.14%
|
7.13%
|
12.06%
|
9.66%
|
10.22%
|
23.59%
|
-1.41%
|
|
FGBLX
|
Fidelity Global Balanced
|
Broadly Diversified
|
-0.41%
|
2.13%
|
3.50%
|
4.63%
|
5.13%
|
13.50%
|
-0.85%
|
|
AWPAX
|
*AllianceBernstein Worldwide Privat A
|
Foreign Large Blend
|
-0.41%
|
4.49%
|
8.21%
|
9.13%
|
10.54%
|
25.82%
|
-1.40%
|
|
KGDAX
|
*Scudder Global Discovery A
|
World Stock
|
-0.49%
|
4.10%
|
6.88%
|
8.74%
|
9.35%
|
27.87%
|
-1.44%
|
Be
advised that many international funds may not be available to you since they
carry a load. However, while I am able to purchase these for my managed
account clients as ‘load waived’ funds, this doesn’t help you much, if you do
your own investing. This is why I have included some appropriate ETFs in the
above list.
4a. A GLOBAL PERSPECTIVE: SELECTIVE BUY
While I
believe that the United
States is the greatest country in the
world to live in, it is not necessarily always the best, or only one, to
invest in.
This
addition to my newsletter will allow us to also invest selectively in
countries with better performing stock markets. With the proliferation of
ETFs over the past years, we are now able to invest in a variety of countries
using low cost index ETFs.
The chart
shows the Austria Index as an example:
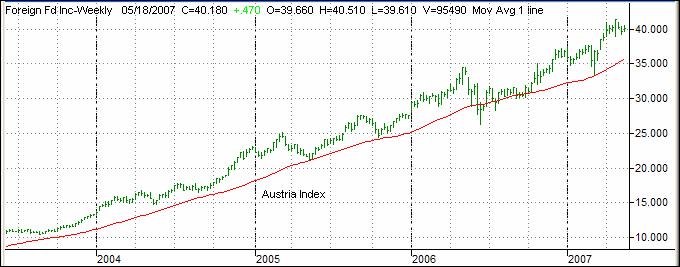
Below is
a list of 37 countries/regions, which I am tracking weekly.
Please
note that the data in this table do not include adjustments due to
distributions.
|
Ticker
|
Fund Name
|
Orientation
|
4Wk
|
8Wk
|
12Wk
|
YTD
|
%M/A
|
DD%
|
|
CH
|
Chile Fund
|
Chile Stock
|
13.39%
|
23.71%
|
26.91%
|
27.66%
|
23.13%
|
0.00%
|
|
EWC
|
iShares Canada Index
|
Foreign Large Value
|
6.28%
|
12.32%
|
16.63%
|
16.63%
|
15.28%
|
-1.80%
|
|
EWW
|
iShares Mexico Index
|
Latin America Stock
|
5.97%
|
10.22%
|
20.06%
|
16.92%
|
19.52%
|
-2.46%
|
|
EWZ
|
iShares Brazil Index
|
Latin America Stock
|
5.06%
|
13.65%
|
23.90%
|
19.74%
|
22.48%
|
-4.92%
|
|
ILF
|
iShares S&P 40 Latin America
|
Latin America Stock
|
4.22%
|
12.29%
|
21.67%
|
18.08%
|
20.21%
|
-4.34%
|
|
PGJ
|
PowerShares Gldn Dragon
|
China
|
3.33%
|
8.90%
|
13.72%
|
7.86%
|
16.62%
|
-5.19%
|
|
EWY
|
iShares S. Korea Index
|
Pacific Asia/excl. Japan
|
3.24%
|
9.59%
|
15.83%
|
12.85%
|
12.96%
|
-1.97%
|
|
EWS
|
iShares Singapore Index
|
Pacific Asia/excl. Japan
|
2.83%
|
8.38%
|
18.19%
|
20.09%
|
19.56%
|
-2.18%
|
|
EWG
|
iShares Germany Index
|
Europe Stock
|
1.59%
|
10.66%
|
17.22%
|
18.26%
|
17.88%
|
-1.21%
|
|
EWP
|
iShares Spain Index
|
Europe Stock
|
1.52%
|
4.31%
|
9.80%
|
9.31%
|
10.80%
|
-1.51%
|
|
EWU
|
iShares United Kingdom Index
|
Europe Stock
|
1.37%
|
4.53%
|
10.16%
|
7.43%
|
7.44%
|
-1.33%
|
|
EWQ
|
iShares France Index
|
Europe Stock
|
0.98%
|
8.36%
|
13.56%
|
11.34%
|
12.22%
|
-1.85%
|
|
EWM
|
iShares Malaysia Index
|
Pacific Asia/excl. Japan
|
0.95%
|
8.53%
|
19.39%
|
28.57%
|
22.32%
|
-4.65%
|
|
IOO
|
S&P Global 100
|
World Stock
|
0.94%
|
6.75%
|
9.54%
|
6.88%
|
7.38%
|
-1.09%
|
|
EWT
|
iShares Taiwan Index
|
Pacific Asia/excl. Japan
|
0.70%
|
2.66%
|
3.40%
|
-1.45%
|
3.10%
|
-3.83%
|
|
FXI
|
iShares China 25 Index
|
Pacific Asia/excl. Japan
|
0.57%
|
5.34%
|
13.62%
|
-1.53%
|
12.54%
|
-5.78%
|
|
FEZ
|
Dow Jones Euro Stoxx 50
|
Europe Stock
|
0.55%
|
8.55%
|
13.64%
|
11.05%
|
12.38%
|
-1.70%
|
|
EZU
|
European Monetary Union Index
|
Europe Stock
|
0.48%
|
7.90%
|
14.04%
|
12.58%
|
13.05%
|
-1.20%
|
|
IEV
|
S&P Europe 350 Index
|
Europe Stock
|
0.20%
|
7.02%
|
11.79%
|
10.13%
|
10.56%
|
-1.43%
|
|
EEM
|
iShares Emerging Mkts Index
|
Div. Emerging Mkts
|
0.19%
|
6.36%
|
13.36%
|
8.43%
|
11.91%
|
-2.73%
|
|
EFA
|
MSCI EAFE iShares Index Fd
|
Foreign Large Blend
|
0.14%
|
4.43%
|
8.60%
|
8.78%
|
8.86%
|
-1.25%
|
|
EFV
|
MSCI EAFE iShares Value Index
|
Foreign Large Blend
|
0.09%
|
4.29%
|
7.80%
|
7.33%
|
8.55%
|
-1.16%
|
|
TF
|
Thai Capital Fund
|
Pacific Asia/excl. Japan
|
-0.42%
|
13.29%
|
16.98%
|
5.71%
|
7.07%
|
-10.09%
|
|
EWJ
|
iShares Japan Index
|
Japan Stock
|
-0.49%
|
-2.59%
|
-2.52%
|
0.77%
|
1.54%
|
-5.42%
|
|
EWK
|
iShares Belgium Index
|
Europe Stock
|
-0.50%
|
4.53%
|
10.71%
|
8.98%
|
9.50%
|
-2.04%
|
|
EWD
|
iShares Sweden Index
|
Europe Stock
|
-0.62%
|
9.85%
|
18.78%
|
13.66%
|
17.16%
|
-1.87%
|
|
EPP
|
iShares Pacific ex. Japan
|
Pacific Asia/excl. Japan
|
-0.72%
|
5.19%
|
11.82%
|
12.33%
|
11.85%
|
-3.45%
|
|
EWH
|
iShares Hong Kong Index
|
Pacific Asia/excl. Japan
|
-1.02%
|
2.79%
|
7.11%
|
3.56%
|
5.59%
|
-4.00%
|
|
EWA
|
iShares Australia Index
|
Foreign Large Blend
|
-1.17%
|
5.48%
|
12.43%
|
14.86%
|
12.89%
|
-3.86%
|
|
EWO
|
iShares Austria Index
|
Europe Stock
|
-1.24%
|
4.43%
|
14.30%
|
10.35%
|
13.58%
|
-2.01%
|
|
EWI
|
iShares Italy Index
|
Europe Stock
|
-1.36%
|
5.70%
|
9.47%
|
7.23%
|
8.14%
|
-2.06%
|
|
IFN
|
India Fund
|
India
|
-1.99%
|
4.31%
|
6.62%
|
-9.87%
|
-4.53%
|
-17.43%
|
|
EWN
|
iShares Netherlands Index
|
Europe Stock
|
-2.21%
|
6.14%
|
16.18%
|
14.33%
|
12.81%
|
-3.25%
|
|
EWL
|
iShares Switzerland Index
|
Europe Stock
|
-2.55%
|
4.21%
|
8.18%
|
7.27%
|
7.69%
|
-2.77%
|
|
EZA
|
iShares South Africa Index
|
N/A
|
-3.00%
|
7.01%
|
13.77%
|
11.98%
|
15.26%
|
-5.29%
|
|
IIF
|
Morgan Stanley India Fund
|
India
|
-3.00%
|
1.44%
|
1.55%
|
-11.08%
|
-4.67%
|
-14.41%
|
|
TKF
|
Turkish Investment Fund
|
Turkey
|
-6.25%
|
0.69%
|
3.48%
|
3.42%
|
0.69%
|
-14.90%
|
As you
just witnessed during May and June 2006, country funds can be volatile and
the use of a trailing stop loss (I use 10%) is imperative to protect your
portfolio from severe downside moves.
4b. TAX-FREE INVESTING
This
section shows some of the Closed End Exchange Traded Bond Funds (CEETBFs) as
discussed in my free e-Book “How to
Earn 5% - 6.5% Tax-Free Income,” which can be downloaded from my site.
This new
addition to the StatSheet is a managed account service I offer. Choosing the
right CEETBF out of over 500 takes a lot of work, and special knowledge is
required to customize a selection of funds specifically suited to your needs.
To
identify the general trend of these funds, I have created the TFI-Index, as
illustrated in the chart below. If the Index (green line) is above its
long-term trend line (red), we are in an environment of lower interest rates.
If it breaks below it, we are seeing interest rates rising.
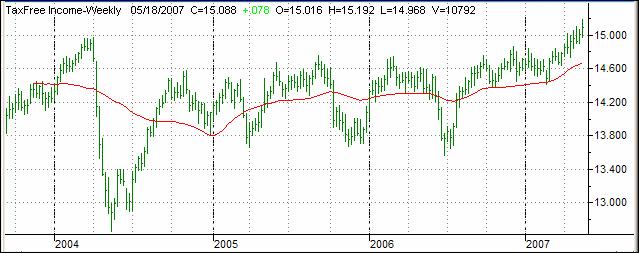
The table
below is a small sampling of what is available. Be advised that the columns
“Discount,” “Current Dividend Yield,” and “YTD” are updated weekly so that
you can see and track the impact changes in interest rates are having. The
data is as of 5/16/2007:
|
Ticker
|
Fund Name
|
1 Yr Ret.
|
Since Incept.
|
10 Yr ann. Ret.
|
Discount
|
Aver. Cred. Rtg.
|
MS
|
C. Div. Yield
|
YTD
|
|
BKN
|
BR Inv. Muni
|
28.80%
|
8.08%
|
10.76%
|
11.83%
|
AAA-44%
|
* * * *
|
5.93%
|
-11.63%
|
|
CXH
|
Col Inv. Grade
|
9.40%
|
5.91%
|
7.03%
|
-2.31%
|
n/a
|
* *
|
5.13%
|
1.38%
|
|
EVM
|
EV Ins CA Muni
|
4.80%
|
2.56%
|
n/a
|
2.43%
|
AAA-87.8%
|
NR
|
4.77%
|
1.97%
|
|
IIC
|
MS CA Ins. Muni
|
10.17%
|
5.28%
|
7.85%
|
0.33%
|
AAA-100.0%
|
* * *
|
4.56%
|
3.21%
|
|
MEN
|
Muni Enh. Fd
|
9.49%
|
7.28%
|
7.49%
|
-5.15%
|
AAA-89.6%
|
* *
|
4.75%
|
-0.55%
|
|
MUC
|
ML MuniHldgs Insured Fd
|
17.20%
|
7.56%
|
n/a
|
-3.33%
|
AAA-93.6%
|
* * * *
|
4.89%
|
-1.32%
|
|
MVF
|
Mun. Vest Fd
|
9.17%
|
7.51%
|
8.07%
|
1.53%
|
AAA-29.6%
|
* * * *
|
5.19%
|
-1.00%
|
|
MYD
|
Mun. Yield Fd
|
16.91%
|
8.11%
|
8.28%
|
5.16%
|
AAA-38.9%
|
* * * *
|
5.27%
|
0.00%
|
|
MYI
|
Mun. Ins. Fd
|
15.51%
|
7.49%
|
7.02%
|
-6.05%
|
AAA-83.8%
|
* * * *
|
4.76%
|
-0.42%
|
|
NCL
|
NV. Ins. CA Muni II
|
-1.43%
|
5.52%
|
7.37%
|
-0.34%
|
AAA-100.0%
|
* * * *
|
4.57%
|
3.02%
|
|
NKX
|
Nuveen Ins. CA Fd
|
0.50%
|
2.98%
|
n/a
|
1.68%
|
AAA-82.1%
|
NR
|
4.69%
|
1.00%
|
|
NUV
|
NV Muni Val. Fd
|
11.46%
|
6.86%
|
6.16%
|
-0.98%
|
AAA-52.6%
|
* *
|
4.62%
|
-2.97%
|
|
NXP
|
NV Sel. TF Fd
|
11.66%
|
5.83%
|
5.42%
|
0.89%
|
AAA-53.8%
|
* *
|
4.64%
|
-0.27%
|
|
PMG
|
PM Muni Fd
|
3.10%
|
5.58%
|
5.65%
|
-6.97%
|
AAA-46.7%
|
* * *
|
4.82%
|
0.16%
|
|
PML
|
PO Muni Inc. Fd II
|
17.38%
|
8.44%
|
n/a
|
2.19%
|
AAA-56.0%
|
NR
|
5.06%
|
-3.57%
|
|
PMO
|
PM Muni Tr
|
-0.58%
|
4.95%
|
5.47%
|
-7.59%
|
AAA-53.0%
|
* * * *
|
4.77%
|
-0.25%
|
Please note
that many of these funds have been around for a long time and therefore 10-yr
annualized returns are available for most of them. All of them are exempt from Federal taxation and,
depending on what state you live in, maybe exempt from State taxation as
well.
Here’s
the glossary of terms used:
1. 1 Yr
Return*: The return over the last 12 months consisting of appreciation and
reinvested dividends.
2. Since
Inception*: The annualized return since the fund started operating.
3. 10 Yr
Annualized Return*: The annualized return over the past 10 years.
4.
Discount from NAV: The discount or premium from Net Asset Value (NAV) this
fund can be currently purchased for.
5.
Average Credit Rating: A key number which shows the quality of the fund with
AAA being the highest. The percentage shows how much of the funds holdings,
as a percentage, are in AAA rated bonds.
6.
Morningstar (MS): The current Morningstar rating. NR means that it is not yet
rated.
7.
Current Div. Yield: That’s the income being generated and it is paid out on a
monthly basis, if you wish. This represents spendable income.
8. YTD:
Shows the Year-To-Date performance (without dividends) to demonstrate the
effect of changes in interest rates. Some funds are showing capital gains,
other capital losses. This is a very short-term view. These types of
investments should only be made with at least a 5-year time horizon.
There are
many other factors, which come into play, when evaluating CEETBFs. This
section is only designed as an introduction. If you do your own investing in
this area, be sure to read my new article titled “The 10 Rules of Successful Tax-Free Income Investing,” which is
posted at:
http://www.successful-investment.com/articles31.htm
If you
have a need to generate reliable monthly income, please call me, or go the
following link and submit your request:
http://www.successful-investment.com/TFI
*As of 12/31/2005
4c. SECTOR FUND INVESTING (ETFs): SELECTIVE BUY
To
diversify our portfolios, we always need to look for different opportunities
to invest our money. The below table of sector fund listings (ETFs) covers a broad
spectrum of possibilities. The sorting order is by 4Wk performance:
|
Ticker
|
Fund Name
|
Orientation
|
4Wk
|
8Wk
|
12Wk
|
YTD
|
%M/A
|
DD%
|
|
IYZ
|
Down Jones US
Telecom
|
Specialty-Commun.
|
4.83%
|
8.17%
|
10.23%
|
13.42%
|
13.33%
|
-0.80%
|
|
VOX
|
Vanguard Telecom
Serv's
|
Specialty-Commun.
|
4.39%
|
7.36%
|
8.51%
|
11.48%
|
11.61%
|
-0.92%
|
|
IGE
|
Goldman Sachs
Natural Res.
|
Specialty-Natural
Res.
|
4.34%
|
9.85%
|
16.59%
|
14.69%
|
15.01%
|
-2.35%
|
|
IXC
|
S&P Global
Energy
|
Specialty-Natural
Res.
|
4.21%
|
9.16%
|
17.30%
|
10.35%
|
12.64%
|
-1.93%
|
|
XLE
|
Energy Select Sector
|
Specialty-Natural
Res.
|
3.98%
|
9.50%
|
17.60%
|
13.92%
|
14.70%
|
-2.32%
|
|
IYE
|
Dow Jones US Energy
|
Specialty-Natural
Res.
|
3.65%
|
9.29%
|
17.56%
|
13.67%
|
14.82%
|
-2.29%
|
|
VDE
|
Vanguard Energy
VIPERS
|
Specialty-Natural
Res.
|
3.61%
|
9.52%
|
17.78%
|
14.80%
|
15.12%
|
-2.27%
|
|
IXP
|
S&P Global
Telecommunications
|
Specialty-Commun.
|
3.37%
|
7.57%
|
11.43%
|
11.80%
|
12.65%
|
-0.59%
|
|
XLK
|
Technology Select
|
Specialty-Technology
|
1.59%
|
6.68%
|
8.16%
|
7.18%
|
7.33%
|
-2.16%
|
|
IYG
|
Dow Jones US
Financial Serv's
|
Specialty-Financial
|
0.86%
|
5.28%
|
4.16%
|
1.05%
|
3.55%
|
-1.71%
|
|
XLV
|
Health Care Select
SPDR
|
Specialty-Health
|
0.69%
|
8.85%
|
9.11%
|
9.41%
|
7.84%
|
-0.38%
|
|
VAW
|
Vanguard Materials
VIPERS
|
Specialty-Natural
Res.
|
0.62%
|
5.67%
|
8.57%
|
16.57%
|
13.63%
|
-1.66%
|
|
VHT
|
Vanguard Health Care
|
Specialty-Health
|
0.47%
|
8.05%
|
8.62%
|
9.34%
|
7.26%
|
-0.51%
|
|
XLF
|
Financial Select
Sector
|
Specialty-Financial
|
0.46%
|
5.40%
|
4.28%
|
2.04%
|
4.14%
|
-1.24%
|
|
IYH
|
Dow Jones US
Healthcare
|
Specialty-Health
|
0.43%
|
8.27%
|
8.35%
|
8.79%
|
7.21%
|
-0.63%
|
|
MTK
|
Morgan Stanley
Technology
|
Specialty-Technology
|
0.32%
|
8.35%
|
7.44%
|
5.94%
|
7.37%
|
-2.27%
|
|
IGM
|
Goldman Sachs Tech.
Index
|
Specialty-Technology
|
0.18%
|
6.24%
|
7.14%
|
5.91%
|
6.67%
|
-2.44%
|
|
IYW
|
Dow Jones US
Technology
|
Specialty-Technology
|
0.14%
|
6.16%
|
6.87%
|
5.12%
|
5.74%
|
-2.52%
|
|
IXG
|
S&P Global
Financial Sector
|
Specialty-Financial
|
0.13%
|
5.23%
|
6.96%
|
3.85%
|
6.06%
|
-1.13%
|
|
VGT
|
Vanguard Info
Technology
|
Specialty-Technolgy
|
0.09%
|
6.05%
|
6.97%
|
5.73%
|
6.08%
|
-2.63%
|
|
IYF
|
Dow Jones US
Financial Sector
|
Specialty-Financial
|
0.06%
|
4.44%
|
3.06%
|
1.31%
|
3.29%
|
-2.17%
|
|
IXN
|
S&P Global
Technology
|
Specialty-Technolgy
|
0.02%
|
5.86%
|
7.46%
|
3.74%
|
5.39%
|
-2.04%
|
|
VFH
|
Vanguard Financials
|
Specialty-Financial
|
0.02%
|
4.38%
|
3.45%
|
1.16%
|
3.47%
|
-1.98%
|
|
IXJ
|
S&P Global
Healthcare
|
Specialty-Health
|
-0.81%
|
5.98%
|
6.95%
|
6.89%
|
5.18%
|
-1.51%
|
|
IGV
|
Goldman Sachs
Software
|
Specialty-Technology
|
-0.87%
|
3.43%
|
5.94%
|
4.82%
|
4.49%
|
-3.03%
|
|
IGN
|
Goldman Sachs
Networking
|
Specialty-Technology
|
-1.21%
|
5.03%
|
2.30%
|
3.89%
|
4.58%
|
-2.79%
|
|
DBC
|
DB Commodity Index
|
Specialty-Natural
Resources
|
-1.56%
|
-1.94%
|
0.92%
|
2.77%
|
2.69%
|
-2.28%
|
|
UTH
|
Utilities HOLDRs
|
Specialty-Utilities
|
-2.17%
|
3.10%
|
7.61%
|
11.01%
|
10.15%
|
-3.90%
|
|
IDU
|
Dow Jones US
Utilities
|
Specialty-Utilities
|
-2.40%
|
2.45%
|
6.38%
|
11.37%
|
9.85%
|
-4.08%
|
|
VPU
|
Vanguard Utilities
VIPERS
|
Specialty-Utilities
|
-2.52%
|
2.30%
|
6.44%
|
11.74%
|
9.97%
|
-4.19%
|
|
XLU
|
Utilities Select
Sector
|
Specialty-Utilities
|
-2.85%
|
2.07%
|
6.03%
|
11.57%
|
9.78%
|
-4.21%
|
|
IIH
|
Internet
Infrastructure HOLDRs
|
Specialty-Technology
|
-2.88%
|
-1.56%
|
-2.88%
|
-7.51%
|
-5.64%
|
-12.93%
|
|
IAU
|
iShares Comex Gold
|
Specialty-Natural
Res.
|
-3.11%
|
-1.37%
|
-1.67%
|
2.43%
|
2.49%
|
-5.49%
|
|
IBB
|
Nasdaq Biotechnology
|
Specialty-Health
|
-3.95%
|
7.01%
|
6.39%
|
3.23%
|
2.67%
|
-3.95%
|
|
IGW
|
Goldman Sachs
Semiconductor
|
Specialty-Technology
|
-4.02%
|
5.19%
|
2.91%
|
3.64%
|
2.31%
|
-4.79%
|
|
BBH
|
Merrill Lynch
Biotech
|
Specialty-Health
|
-5.38%
|
1.65%
|
-0.67%
|
-3.22%
|
-3.76%
|
-9.70%
|
|
IYR
|
Dow Jones US Real
Estate
|
Specialty-Real
Estate
|
-7.56%
|
-4.61%
|
-7.98%
|
-3.36%
|
-3.92%
|
-14.98%
|
|
VNQ
|
Vanguard REIT Index
|
Specialty-Real
Estate
|
-8.23%
|
-5.27%
|
-8.44%
|
-3.83%
|
-4.78%
|
-15.02%
|
|
RWR
|
Wilshire REIT Fund
|
Specialty-Real
Estate
|
-8.38%
|
-5.47%
|
-8.88%
|
-3.85%
|
-4.81%
|
-15.41%
|
|
ICF
|
Cohen & Steers
Realty
|
Specialty-Real
Estate
|
-9.57%
|
-6.76%
|
-10.66%
|
-5.31%
|
-5.78%
|
-17.74%
|
I
personally invest no more than 5% of portfolio value in any one sector and
use a 10% trailing stop loss to minimize the risk. I have taken a new position
and will add more if market momentum keeps improving.
4d. FIDELITY SELECT SECTOR FUNDS: SELECTIVE BUY
If you
prefer using Fidelity’s wide variety of excellent sector funds, you will like
this new addition. Here as well, sectors can be volatile, and I advise the
use of a sell stop just as we do with ETFs.
The
sorting order is by 4Wk performance:
|
Ticker
|
Fund Name
|
Orientation
|
4Wk
|
8Wk
|
12Wk
|
YTD
|
%M/A
|
DD%
|
|
FWRLX
|
Fid. Sel. Wireless
|
Utilities
|
5.28%
|
10.99%
|
12.55%
|
14.00%
|
13.60%
|
-0.62%
|
|
FSESX
|
Fid. Sel. Energy Service
|
Natural Resources
|
4.36%
|
11.31%
|
21.12%
|
20.63%
|
19.33%
|
-2.87%
|
|
FSTCX
|
Fid. Sel. Telecommunications
|
Utilities
|
4.16%
|
7.35%
|
9.43%
|
13.46%
|
12.73%
|
-1.03%
|
|
FSENX
|
Fid. Sel. Energy
|
Natural Resources
|
3.27%
|
9.08%
|
16.22%
|
16.29%
|
15.58%
|
-2.23%
|
|
FNARX
|
Fid. Sel. Natural Resources
|
Natural Resources
|
3.12%
|
9.18%
|
15.89%
|
19.19%
|
17.69%
|
-2.25%
|
|
FDCPX
|
Fid. Sel. Computers
|
Technology
|
2.67%
|
5.88%
|
6.96%
|
6.23%
|
7.45%
|
-2.08%
|
|
FSCGX
|
Fid. Sel. Industrial Equipment
|
Cyclicals
|
2.66%
|
7.18%
|
8.17%
|
9.69%
|
9.79%
|
-0.90%
|
|
FBSOX
|
Fid. Sel. Business/Outsourcing
|
Technology
|
2.18%
|
7.27%
|
8.35%
|
9.39%
|
10.34%
|
-0.92%
|
|
FSNGX
|
Fid. Sel. Natural Gas
|
Natural Resources
|
2.10%
|
7.96%
|
13.72%
|
18.42%
|
14.93%
|
-2.74%
|
|
FCYIX
|
Fid. Sel. Cyclical Industries
|
Cyclicals
|
2.05%
|
6.85%
|
7.27%
|
8.01%
|
8.14%
|
-1.03%
|
|
FSDAX
|
Fid. Sel. Defense/Aerospace
|
Cyclicals
|
1.66%
|
3.46%
|
4.83%
|
7.94%
|
8.22%
|
-1.65%
|
|
FIUIX
|
Fid. Sel. Utilities
|
Utilities
|
1.59%
|
5.37%
|
9.55%
|
13.68%
|
12.90%
|
-2.27%
|
|
FSVLX
|
Fid. Sel. Home Finance
|
Financials
|
1.36%
|
4.88%
|
3.06%
|
0.78%
|
2.90%
|
-1.37%
|
|
FSPCX
|
Fid. Sel. Insurance
|
Financials
|
1.33%
|
5.59%
|
5.93%
|
3.87%
|
5.96%
|
-1.23%
|
|
FSHCX
|
Fid. Sel. Medical Delivery
|
Health Care
|
1.05%
|
7.85%
|
9.21%
|
13.67%
|
11.55%
|
-0.36%
|
|
FSDPX
|
Fid. Sel. Industrial Materials
|
Cyclicals
|
0.93%
|
5.39%
|
7.34%
|
13.72%
|
12.26%
|
-1.72%
|
|
FSAVX
|
Fid. Sel. Automotive
|
Cyclicals
|
0.86%
|
7.89%
|
8.13%
|
12.20%
|
11.32%
|
-1.92%
|
|
FSCHX
|
Fid. Sel. Chemicals
|
Cyclicals
|
0.86%
|
3.69%
|
5.39%
|
9.74%
|
9.34%
|
-1.61%
|
|
FSHOX
|
Fid. Sel. Construction/Housing
|
Cyclicals
|
0.61%
|
4.86%
|
2.27%
|
4.88%
|
6.82%
|
-1.73%
|
|
FPHAX
|
Fid. Sel. Pharmaceuticals
|
Health Care
|
0.48%
|
10.88%
|
12.26%
|
12.47%
|
10.09%
|
-0.71%
|
|
FSRBX
|
Fid. Sel. Banking
|
Financials
|
0.48%
|
2.14%
|
1.60%
|
0.29%
|
1.79%
|
-1.39%
|
|
FSRFX
|
Fid. Sel. Transportation
|
Cyclicals
|
0.36%
|
6.28%
|
5.62%
|
11.02%
|
8.08%
|
-1.66%
|
|
FBMPX
|
Fid. Sel. Multimedia
|
Consumer
|
0.31%
|
3.66%
|
4.66%
|
3.14%
|
5.32%
|
-1.05%
|
|
FSPFX
|
Fid. Sel. Paper/Forest Products
|
Natural Resources
|
0.21%
|
4.51%
|
3.41%
|
9.35%
|
9.44%
|
-1.43%
|
|
FIDSX
|
Fid. Sel. Financial Services
|
Financials
|
0.18%
|
4.03%
|
3.96%
|
2.94%
|
4.27%
|
-0.94%
|
|
FSPHX
|
Fid. Sel. Health Care
|
Health Care
|
0.16%
|
6.15%
|
6.68%
|
7.22%
|
6.13%
|
-0.50%
|
|
FDLSX
|
Fid. Sel. Leisure
|
Consumer
|
0.12%
|
3.07%
|
3.92%
|
4.18%
|
5.91%
|
-1.49%
|
|
FDFAX
|
Fid. Sel. Food & Agriculture
|
Consumer
|
-0.19%
|
3.24%
|
6.19%
|
7.46%
|
7.10%
|
-0.91%
|
|
FSLBX
|
Fid. Sel. Brokerage/Inv. Mgmnt
|
Financials
|
-0.47%
|
5.22%
|
6.09%
|
5.13%
|
6.25%
|
-1.14%
|
|
FSLEX
|
Fid. Sel. Environmental
|
Cyclicals
|
-0.50%
|
3.19%
|
4.15%
|
3.07%
|
3.58%
|
-1.82%
|
|
FSCSX
|
Fid. Sel. Software/Computer Serv's
|
Technology
|
-0.54%
|
3.09%
|
4.88%
|
4.96%
|
5.41%
|
-1.85%
|
|
FSMEX
|
Fid. Sel. Medical Equipment
|
Health Care
|
-0.92%
|
2.38%
|
4.92%
|
6.40%
|
5.07%
|
-0.92%
|
|
FSAIX
|
Fid. Sel. Air Transportation
|
Cyclicals
|
-1.05%
|
1.34%
|
0.25%
|
4.67%
|
4.65%
|
-4.82%
|
|
FSCPX
|
Fid. Sel. Consure Industries
|
Consumer
|
-1.11%
|
2.00%
|
3.59%
|
5.37%
|
4.24%
|
-1.52%
|
|
FSDCX
|
Fid. Sel. Devel. Communications
|
Technology
|
-1.35%
|
4.72%
|
6.86%
|
7.28%
|
6.30%
|
-3.05%
|
|
FSRPX
|
Fid. Sel. Retailing
|
Consumer
|
-1.43%
|
1.42%
|
2.92%
|
6.58%
|
4.84%
|
-1.66%
|
|
FSPTX
|
Fid. Sel. Technology
|
Technology
|
-1.50%
|
3.25%
|
3.61%
|
6.38%
|
5.73%
|
-2.58%
|
|
FSUTX
|
Fid. Sel. Utilities Growth
|
Utilities
|
-1.77%
|
3.09%
|
7.71%
|
13.47%
|
11.95%
|
-3.87%
|
|
FNINX
|
Fid. Sel. Networking/Infrastruct.
|
Technology
|
-3.11%
|
2.05%
|
0.81%
|
0.81%
|
1.72%
|
-3.86%
|
|
FSAGX
|
Fid. Sel. Gold
|
Natural Resources
|
-3.13%
|
-2.28%
|
-1.95%
|
-2.81%
|
-0.18%
|
-7.14%
|
|
FBIOX
|
Fid. Sel. Biotechnology
|
Health Care
|
-3.41%
|
6.14%
|
4.77%
|
1.14%
|
1.53%
|
-4.31%
|
|
FSELX
|
Fid. Sel. Electronics
|
Technology
|
-4.32%
|
5.19%
|
2.58%
|
7.14%
|
5.10%
|
-5.26%
|
4f. T. ROWE PRICE, RYDEX, VANGUARDNEW
& AMERICAN CENTURY SECTOR FUNDS: SELECTIVE BUY
This is my
latest addition to the StatSheet, which features sector funds from these four
fund families:
|
Ticker
|
Fund Name
|
Orientation
|
4Wk
|
8Wk
|
12Wk
|
YTD
|
%M/A
|
DD%
|
|
VGENX
|
Vanguard Energy
|
Specialty-Natural Resources
|
4.13%
|
9.15%
|
15.40%
|
11.67%
|
11.89%
|
-2.13%
|
|
RYVIX
|
Rydex Energy Services Inv
|
Specialty-Natural Resources
|
3.54%
|
10.17%
|
20.15%
|
20.32%
|
18.36%
|
-3.19%
|
|
RYEIX
|
Rydex Energy
|
Specialty Natural Resources
|
3.45%
|
8.97%
|
16.38%
|
15.01%
|
14.44%
|
-2.51%
|
|
PRMTX
|
T. Rowe Price Media/Telecom
|
Specialty-Communications
|
3.25%
|
10.69%
|
12.37%
|
14.64%
|
15.03%
|
-1.26%
|
|
PRNEX
|
T. Rowe Price New Era
|
Specialty-Natural Resources
|
2.99%
|
9.37%
|
15.22%
|
15.56%
|
15.45%
|
-2.27%
|
|
RYMIX
|
Rydex Telecommunications Inv
|
Specialty-Communications
|
2.54%
|
7.52%
|
9.30%
|
10.63%
|
10.64%
|
-0.99%
|
|
VGPMX
|
Vanguard Prec. Metals & Mining
|
Specialty-Prec. Metals
|
2.29%
|
8.31%
|
14.42%
|
15.96%
|
14.72%
|
-1.99%
|
|
RYIIX
|
Rydex Internet
|
Specialty-Technology
|
1.54%
|
6.16%
|
6.57%
|
6.99%
|
7.62%
|
-2.07%
|
|
RYBIX
|
Rydex Basic Materials
|
Specialty-Natural Resources
|
1.16%
|
5.89%
|
8.47%
|
17.34%
|
15.00%
|
-2.10%
|
|
PRISX
|
T. Rowe Price Financial Serv's
|
Specialty-Financial
|
0.95%
|
4.45%
|
4.48%
|
5.09%
|
6.16%
|
-0.65%
|
|
VMIAX
|
Vanguard Materials Index
|
Specialty-Natural Resources
|
0.70%
|
5.56%
|
8.49%
|
16.40%
|
13.70%
|
-1.67%
|
|
ALSIX
|
American Century Life Sciences Inv
|
Specialty-Health
|
0.35%
|
6.43%
|
7.62%
|
10.08%
|
7.25%
|
-0.52%
|
|
VITAX
|
Vanguard Information Techn.
|
Specialty-Technology
|
0.21%
|
6.08%
|
7.03%
|
5.88%
|
6.22%
|
-2.50%
|
|
RYHIX
|
Rydex Health Care Inv
|
Specialty-Health
|
0.12%
|
6.95%
|
7.44%
|
9.17%
|
7.52%
|
-0.49%
|
|
BULIX
|
American Century Utilities Inv
|
Specialty-Utilities
|
0.10%
|
4.59%
|
8.90%
|
13.06%
|
12.09%
|
-2.60%
|
|
ATCIX
|
American Century Technology Inv
|
Specialty-Technology
|
0.04%
|
4.28%
|
9.10%
|
8.84%
|
8.91%
|
-2.14%
|
|
PRDTX
|
T. Rowe Price Develop. Techn.
|
Specialty-Technology
|
0.00%
|
6.44%
|
6.44%
|
8.47%
|
8.53%
|
-2.48%
|
|
RYKIX
|
Rydex Banking
|
Specialty-Financial
|
0.00%
|
1.82%
|
0.17%
|
-2.16%
|
0.20%
|
-4.00%
|
|
VFAIX
|
Vanguard Financials Index
|
Specialty-Financial
|
0.00%
|
4.30%
|
3.36%
|
1.37%
|
3.49%
|
-1.98%
|
|
RYPIX
|
Rydex Transportation
|
Mid-Cap Blend
|
-0.16%
|
5.13%
|
3.74%
|
9.70%
|
6.21%
|
-2.46%
|
|
PRHSX
|
T. Rowe Price Health
|
Specialty-Health
|
-0.32%
|
6.79%
|
8.23%
|
9.91%
|
8.96%
|
-0.79%
|
|
VGHCX
|
Vanguard Health Care
|
Specialty-Health
|
-0.37%
|
5.33%
|
6.52%
|
7.61%
|
6.05%
|
-0.86%
|
|
RYTIX
|
Rydex Technology Inv
|
Specialty-Technology
|
-0.38%
|
5.34%
|
6.27%
|
6.96%
|
6.41%
|
-2.36%
|
|
RYCIX
|
Rydex Consumer Products
|
Large Blend
|
-0.63%
|
3.27%
|
5.70%
|
6.00%
|
5.97%
|
-1.03%
|
|
RYLIX
|
Rydex Leisure
|
Mid-Cap Growth
|
-0.97%
|
2.90%
|
3.48%
|
3.25%
|
5.69%
|
-1.71%
|
|
RYFIX
|
Rydex Financial Services Inv
|
Specialty-Financial
|
-1.05%
|
2.88%
|
1.90%
|
1.35%
|
3.02%
|
-3.16%
|
|
RYRIX
|
Rydex Retailing
|
Large Growth
|
-1.73%
|
2.35%
|
4.30%
|
5.87%
|
4.86%
|
-1.73%
|
|
RYUIX
|
Rydex Utilities
|
Specialty-Utilties
|
-2.27%
|
2.10%
|
6.51%
|
10.69%
|
9.64%
|
-4.03%
|
|
RYOIX
|
Rydex Biotechnology Inv
|
Specialty-Health
|
-3.70%
|
6.26%
|
6.16%
|
2.75%
|
1.14%
|
-4.36%
|
|
RYPMX
|
Rydex Precious Metals Inv
|
Specialty-Precious Metals
|
-4.54%
|
-2.29%
|
-0.69%
|
-2.57%
|
0.43%
|
-10.33%
|
|
RYSIX
|
Rydex Electronics Inv
|
Specialty-Technology
|
-4.74%
|
3.96%
|
2.14%
|
3.46%
|
2.25%
|
-4.88%
|
|
REACX
|
American Century Real Estate Inv
|
Specialty-Real Estate
|
-5.33%
|
-3.22%
|
-4.79%
|
-1.77%
|
-1.62%
|
-9.50%
|
|
RYHRX
|
Rydex Real Estate
|
Specialty-Real Estate
|
-6.52%
|
-3.40%
|
-5.87%
|
-2.50%
|
-2.08%
|
-12.26%
|
|
TRREX
|
T. Rowe Price Real Estate
|
Specialty-Real Estate
|
-7.07%
|
-4.24%
|
-6.84%
|
-2.74%
|
-2.68%
|
-12.42%
|
|
VGSIX
|
Vanguard REIT Index
|
Specialty-Real Estate
|
-8.22%
|
-5.35%
|
-8.49%
|
-3.95%
|
-4.77%
|
-15.07%
|
4f. NEW VENTURE OPPORTUNITY
ETFs: SELECTIVE BUY
If you
prefer having an aggressive ingredient in part of your assets, the New Venture
Opportunity ETFs, which focus on future oriented sectors such as biotech,
water, clean energy and nanotech, for example, can help boost a portfolio’s
return.
To work
profitably for you, these more volatile investments have to be managed with
discipline through the use of a clearly defined exit point just like sector
funds. I personally use a 10% trailing stop loss and will not commit more
than 5% of portfolio value to any one position.
|
Ticker
|
Fund Name
|
Orientation
|
4Wk
|
8Wk
|
12Wk
|
YTD
|
%M/A
|
DD%
|
|
PXJ
|
Dynamic Oil & Gas Services
|
Oil & Gas
|
4.94%
|
14.13%
|
23.75%
|
21.88%
|
20.26%
|
-3.47%
|
|
PXE
|
PowerShares Dyn. Energy Explor.
|
Energy
|
3.62%
|
8.71%
|
18.70%
|
18.51%
|
16.27%
|
-2.70%
|
|
PPA
|
Aerospace & Defense
|
Aerospace/Defense
|
2.62%
|
7.16%
|
8.62%
|
11.95%
|
11.77%
|
-1.47%
|
|
PBS
|
Dynamic Media
|
Media
|
1.56%
|
5.79%
|
4.62%
|
5.01%
|
7.67%
|
-1.45%
|
|
PEJ
|
PowerShares Dyn. Leisure & Ent.
|
Leisure & Entertainment
|
1.29%
|
3.86%
|
4.50%
|
4.79%
|
6.22%
|
-1.26%
|
|
PHO
|
Water Resources
|
Water Resources
|
1.08%
|
5.02%
|
6.27%
|
6.74%
|
7.53%
|
-2.04%
|
|
PJP
|
Dynamic Pharmaceuticals
|
Pharmaceuticals
|
-1.36%
|
9.06%
|
8.63%
|
7.98%
|
7.18%
|
-1.46%
|
|
PZI
|
Zacks Micro Cap
|
Micro Cap
|
-1.45%
|
1.10%
|
2.22%
|
3.02%
|
4.46%
|
-2.70%
|
|
PSJ
|
Dynamic Software
|
Software
|
-2.41%
|
1.46%
|
3.64%
|
5.15%
|
4.15%
|
-2.70%
|
|
PXN
|
Lux Nanotech
|
Nanotechnology
|
-2.52%
|
1.28%
|
1.46%
|
0.99%
|
-0.41%
|
-5.90%
|
|
PBE
|
Dyn. Biotechnology/Genome
|
Biotech & Genome
|
-3.05%
|
7.38%
|
8.60%
|
7.74%
|
5.08%
|
-3.39%
|
|
PBW
|
WilderHill Clean Energy
|
Clean Energy
|
-5.32%
|
0.47%
|
4.44%
|
9.93%
|
5.57%
|
-5.56%
|
All of
them are PowerShares ETFs, and I am certain that this list will be expanded
as more become available. I will wait for stronger momentum figures before
making any new purchases.
5. ON THE HORIZON: Bear Market
Funds: SELL
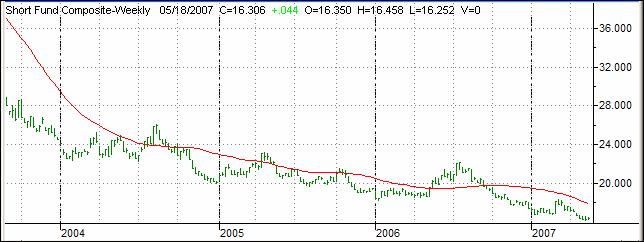
The above
indicator represents our Short Fund Composite (SFC) to be used as a trend
indicator for Bear Market Funds.
After
having stayed above its long-term trend line during the correction of
May/June 06, the SFC has now broken below it by -9.31%. I will not take any
positions until our TTI (section 1) breaks ‘below’ its trend line and the SFC
breaks ‘above’ its trend line, which would confirm bearish tendencies, before
I consider committing to this market.
Below are
the most commonly available bear market funds and their momentum figures:
|
Ticker
|
Fund Name
|
Orientation
|
4Wk
|
8Wk
|
12Wk
|
YTD
|
%M/A
|
|
UCPIX
|
ProFunds UltraShort Small-Cap (200%)
|
Bear Market
|
2.48%
|
-4.90%
|
-6.91%
|
-6.98%
|
-9.04%
|
|
RYVNX
|
Rydex Venture 100 (200%)
|
Bear Market
|
2.08%
|
-9.05%
|
-10.46%
|
-9.30%
|
-9.50%
|
|
USPIX
|
ProFunds UltraShort OTC (200%)
|
Bear Market
|
2.02%
|
-8.84%
|
-10.21%
|
-9.03%
|
-9.27%
|
|
SHPIX
|
ProFunds Short Small Cap Inv
|
Bear Market
|
1.43%
|
-2.01%
|
-2.79%
|
-2.40%
|
-3.37%
|
|
SOPIX
|
ProFunds Short OTC Inv
|
Bear Market
|
1.18%
|
-4.10%
|
-4.61%
|
-3.58%
|
-3.67%
|
|
UIPIX
|
ProFunds UltraShort (200%)
|
Bear Market
|
0.38%
|
-7.78%
|
-9.74%
|
-15.26%
|
-13.50%
|
|
BEARX
|
Prudent Bear
|
Bear Market
|
0.32%
|
-2.49%
|
-2.34%
|
-0.16%
|
-0.46%
|
|
GRZZX
|
Grizzly Short Fund
|
Bear Market
|
0.19%
|
-5.69%
|
-5.36%
|
-6.53%
|
-7.11%
|
|
DRCVX
|
*Comstock Capital Value A
|
Bear Market
|
0.00%
|
-4.26%
|
-3.91%
|
-3.23%
|
-3.68%
|
|
SH
|
Short S&P 500 ProShares ETF
|
Bear Market
|
-0.32%
|
-4.57%
|
-6.17%
|
-4.09%
|
-5.67%
|
|
BRPIX
|
ProFunds Bear Inv
|
Bear Market
|
-0.40%
|
-4.34%
|
-5.27%
|
-3.50%
|
-4.40%
|
|
PSPSX
|
Potomac U.S./Short
|
Bear Market
|
-0.45%
|
-4.63%
|
-5.55%
|
-3.83%
|
-4.78%
|
|
CPFAX
|
*Comstock Strategy A
|
Bear Market
|
-0.73%
|
-3.56%
|
-4.24%
|
-4.58%
|
-4.39%
|
|
URPIX
|
ProFunds UltraBear Inv (200%)
|
Bear Market
|
-1.16%
|
-9.13%
|
-11.09%
|
-8.52%
|
-10.21%
|
|
RYTPX
|
Rydex Tempest 500 H (200%)
|
Bear Market
|
-1.17%
|
-9.27%
|
-11.28%
|
-8.51%
|
-10.31%
|
|
UWPIX
|
ProFunds UltraShort Dow30(200%)
|
Bear Market
|
-4.28%
|
-13.88%
|
-15.06%
|
-11.16%
|
-13.51%
|
|
RYCWX
|
Rydex Inverse
Dow 30 (200%)
|
Bear Market
|
-4.47%
|
-14.42%
|
-15.63%
|
-11.72%
|
-14.01%
|
Please
note that some of the above funds try to outperform the index they are tied
to by the percentage stated. While this can enhance your returns it can
certainly accelerate your losses as well. Personally, I prefer the conservative
route and, therefore, I will not use the leverage available.
6. 401(k) Funds (domestic): BUY
Below is
a list of commonly held 401(k) domestic
equity mutual funds showing their latest momentum figures to go along with the
Buy and Sell signals of the TTI in section 1. The same stop loss rules apply
here as well.
Since
fund choices are limited in any 401k plan, be sure to roll your assets into
an IRA if you leave your job. Let me know if you need help with that.
In the
meantime, however, you can benefit greatly by at least not buying the worst
fund at the wrong time. If you follow our plan, you will never again buy one
of those highly volatile sector funds, when you really should be out of the
market altogether.
Since this
list has grown quite a bit, I have sorted it now by Ticker Symbol in
alphabetical order. This should make it easier for you to locate those funds
you are tracking:
|
Ticker
|
Fund Name
|
Orientation
|
4Wk
|
8WK
|
12Wk
|
YTD
|
%M/A
|
Since 9/6/06
|
DD%
|
|
AAGFX
|
AIM Aggressive Growth
|
Mid-Cap Growth
|
0.00%
|
0.00%
|
0.00%
|
0.00%
|
0.00%
|
0.00%
|
0.00%
|
|
ABALX
|
American Balanced
|
Domestic Hybrid
|
0.93%
|
3.74%
|
4.50%
|
4.50%
|
5.01%
|
10.97%
|
-0.52%
|
|
ACVIX
|
American Century Small Cap
|
Small Value
|
-0.56%
|
2.39%
|
3.59%
|
4.43%
|
4.97%
|
12.84%
|
-1.26%
|
|
AGTHX
|
American Growth
|
Large Growth
|
1.03%
|
5.68%
|
7.51%
|
7.20%
|
7.50%
|
15.22%
|
-0.88%
|
|
AIVSX
|
American ICA
|
Large Value
|
1.11%
|
4.90%
|
6.23%
|
5.96%
|
6.39%
|
12.75%
|
-0.64%
|
|
ALARX
|
*Alger Capital Appreciation Instl I
|
Large Growth
|
0.27%
|
5.64%
|
8.64%
|
12.83%
|
11.48%
|
26.21%
|
-1.58%
|
|
ALMRX
|
*Alger MidCap Growth Institutional I
|
Mid-Cap Growth
|
0.49%
|
5.12%
|
7.37%
|
10.52%
|
10.27%
|
23.24%
|
-1.57%
|
|
ARGFX
|
Ariel
|
Small Value
|
1.23%
|
5.28%
|
4.49%
|
8.49%
|
8.12%
|
17.57%
|
-1.04%
|
|
ARTMX
|
Artisan Mid Cap
|
Mid-Cap Growth
|
-0.18%
|
7.60%
|
9.61%
|
10.20%
|
9.83%
|
21.22%
|
-1.60%
|
|
ASQAX
|
American Century Sm. Cap
|
Small Blend
|
-0.47%
|
3.84%
|
5.31%
|
6.72%
|
6.56%
|
16.19%
|
-1.78%
|
|
AVFIX
|
American Small Cap Value
|
Small Value
|
0.29%
|
4.58%
|
5.74%
|
7.34%
|
7.54%
|
17.72%
|
-1.60%
|
|
AWSHX
|
Washington Mutual Investors
|
Large Value
|
1.56%
|
5.98%
|
7.48%
|
7.10%
|
7.80%
|
16.11%
|
-0.79%
|
|
BERIX
|
Berwyn Income
|
Conservative Allocation
|
-0.42%
|
1.05%
|
1.84%
|
3.31%
|
3.03%
|
7.40%
|
-0.69%
|
|
BGRFX
|
Baron Growth
|
Small Growth
|
-0.33%
|
2.94%
|
3.89%
|
5.33%
|
6.29%
|
19.18%
|
-1.21%
|
|
BIASX
|
Brown Small Cap Growth
|
Small Growth
|
-0.08%
|
4.23%
|
6.48%
|
8.30%
|
8.16%
|
23.47%
|
-1.92%
|
|
BSCFX
|
Baron Small Cap
|
Small Growth
|
-0.83%
|
2.68%
|
3.49%
|
5.85%
|
6.34%
|
20.19%
|
-1.34%
|
|
BUFBX
|
Buffalo Balanced
|
Moderate Allocation
|
1.50%
|
4.63%
|
6.35%
|
5.53%
|
6.18%
|
11.24%
|
-0.73%
|
|
BUFSX
|
Buffalo Small Cap
|
Small Growth
|
-0.41%
|
3.72%
|
4.61%
|
6.83%
|
6.37%
|
18.42%
|
-1.58%
|
|
CAAPX
|
Ariel Appreciation
|
Mid-Cap Blend
|
1.44%
|
6.76%
|
7.06%
|
8.41%
|
8.75%
|
20.51%
|
-0.65%
|
|
CGMFX
|
CGM Focus
|
Small Blend
|
-0.24%
|
2.51%
|
8.46%
|
9.92%
|
8.21%
|
12.30%
|
-2.05%
|
|
CSTGX
|
AIM Constellation
|
Large Growth
|
1.32%
|
6.83%
|
9.25%
|
8.50%
|
8.39%
|
17.27%
|
-1.39%
|
|
CVGRX
|
*Calamos Growth
|
Mid-Cap Growth
|
0.45%
|
5.44%
|
8.13%
|
7.58%
|
7.12%
|
15.92%
|
-1.66%
|
|
DGTIX
|
Delaware Trend Institutional
|
Mid-Cap Growth
|
-0.68%
|
3.83%
|
5.46%
|
6.10%
|
5.98%
|
17.79%
|
-1.98%
|
|
DMCVX
|
Dreyfus Mid Cap Value
|
Mid-Cap Blend
|
-0.35%
|
5.03%
|
6.46%
|
9.87%
|
9.11%
|
21.41%
|
-1.63%
|
|
DODGX
|
Dodge & Cox Stock
|
Large Value
|
1.01%
|
4.76%
|
6.37%
|
6.53%
|
7.17%
|
16.19%
|
-0.90%
|
|
DRLCX
|
Pimco Large Cap Growth
|
Large Growth
|
0.37%
|
5.36%
|
6.76%
|
6.48%
|
6.66%
|
14.83%
|
-1.23%
|
|
EMTGX
|
Eaton Vance Growth
|
Large Blend
|
0.65%
|
5.38%
|
6.36%
|
5.34%
|
6.05%
|
13.78%
|
-0.91%
|
|
FKREX
|
Franklin Capital Growth (A)
|
Large Growth
|
1.64%
|
6.90%
|
7.96%
|
7.51%
|
7.59%
|
16.04%
|
-1.29%
|
|
FRBSX
|
Franklin Balance Sheet
|
Small Value
|
0.37%
|
4.42%
|
6.02%
|
9.22%
|
8.61%
|
18.55%
|
-1.39%
|
|
GMRAX
|
Gartmore Small Cap
|
Small Blend
|
-1.05%
|
2.73%
|
3.65%
|
4.15%
|
1.46%
|
6.14%
|
-4.08%
|
|
GRISX
|
Gartmore S&P 500
|
Large Blend
|
0.97%
|
5.85%
|
7.27%
|
6.43%
|
7.27%
|
16.18%
|
-1.09%
|
|
GSSIX
|
Goldman Sachs Small Cap
|
Small Value
|
-0.78%
|
2.23%
|
2.88%
|
3.92%
|
4.41%
|
12.38%
|
-1.68%
|
|
GTSAX
|
AIM Small Cap Growth
|
Small Growth
|
1.29%
|
5.46%
|
6.92%
|
9.49%
|
9.20%
|
20.89%
|
-1.81%
|
|
GTSGX
|
Mosaic Mid-Cap
|
Mid-Cap Blend
|
0.65%
|
4.85%
|
5.57%
|
7.36%
|
7.25%
|
17.48%
|
-0.70%
|
|
GTVLX
|
AIM Basic Value
|
Large Value
|
1.37%
|
6.25%
|
7.29%
|
6.77%
|
8.10%
|
18.38%
|
-1.01%
|
|
HFMCX
|
*Hartford Midcap A
|
Mid-Cap Growth
|
2.01%
|
7.62%
|
8.89%
|
11.96%
|
10.88%
|
21.36%
|
-1.42%
|
|
HRVIX
|
Heartland Value Plus
|
Small Value
|
-0.31%
|
3.03%
|
5.50%
|
10.00%
|
9.15%
|
23.07%
|
-1.53%
|
|
HWLIX
|
Hotchkis and Wiley Large Cap
|
Large Value
|
0.41%
|
5.76%
|
5.65%
|
7.22%
|
7.86%
|
18.87%
|
-1.40%
|
|
ICAEX
|
ICAP Equity
|
Large Value
|
1.40%
|
5.00%
|
7.08%
|
6.12%
|
7.11%
|
14.68%
|
-0.86%
|
|
ITHAX
|
*Hartford Capital Appreciation A
|
Large Blend
|
1.32%
|
5.57%
|
7.71%
|
5.88%
|
7.40%
|
16.30%
|
-1.36%
|
|
JAENX
|
Janus Enterprise
|
Mid-Cap Growth
|
0.04%
|
6.01%
|
7.45%
|
10.74%
|
9.58%
|
23.67%
|
-1.66%
|
|
JAMRX
|
Janus Mercury
|
Large Growth
|
0.24%
|
6.98%
|
10.02%
|
14.51%
|
12.14%
|
25.71%
|
-1.51%
|
|
JMCVX
|
Janus Mid Cap Value Investor
|
Mid-Cap Value
|
0.20%
|
4.37%
|
5.32%
|
7.81%
|
7.51%
|
17.17%
|
-1.34%
|
|
JPDVX
|
JP Morgan Diversified
|
Large Blend
|
0.34%
|
3.38%
|
4.53%
|
5.40%
|
5.60%
|
12.48%
|
-0.73%
|
|
JRMSX
|
Janus Risk Managed stock
|
Large Blend
|
-0.74%
|
2.81%
|
4.52%
|
4.96%
|
4.94%
|
12.29%
|
-1.28%
|
|
JSVAX
|
Janus Contrarian Fund
|
Mid-Cap Blend
|
0.41%
|
8.13%
|
9.71%
|
14.25%
|
13.85%
|
31.15%
|
-1.67%
|
|
KDHAX
|
*Scudder Dreman High Return Eq A
|
Large Value
|
1.92%
|
5.85%
|
7.13%
|
5.05%
|
6.77%
|
12.66%
|
-0.95%
|
|
KDHBX
|
Scudder Equity
|
Large Value
|
1.92%
|
5.93%
|
7.18%
|
4.90%
|
6.70%
|
12.47%
|
-0.99%
|
|
KDSBX
|
Scudder Small Value
|
Small Value
|
-0.37%
|
3.08%
|
5.86%
|
5.76%
|
6.62%
|
15.06%
|
-1.38%
|
|
LAVLX
|
Lord Abbett Mid Cap Value
|
Mid-Cap Value
|
-0.44%
|
3.84%
|
4.98%
|
7.58%
|
7.42%
|
17.71%
|
-1.37%
|
|
LLPFX
|
Longleaf Partners
|
Large Blend
|
1.04%
|
4.66%
|
5.03%
|
6.23%
|
6.40%
|
17.88%
|
-1.11%
|
|
LMNVX
|
Legg Mason Value Institutional
|
Large Blend
|
1.61%
|
8.56%
|
7.75%
|
7.17%
|
9.24%
|
21.41%
|
-0.80%
|
|
LOMCX
|
CGM Capital
|
Mid-Cap Blend
|
-2.10%
|
3.94%
|
7.00%
|
12.67%
|
8.63%
|
15.60%
|
-2.47%
|
|
MCGIX
|
ABN Amro/Montag
|
Large Growth
|
1.82%
|
5.62%
|
7.23%
|
6.30%
|
6.99%
|
14.98%
|
-0.95%
|
|
MEIAX
|
MFS Value Fund-A
|
Large Value
|
1.39%
|
5.60%
|
7.44%
|
7.94%
|
8.57%
|
18.87%
|
-1.03%
|
|
MGSEX
|
Managers Special Equity
|
Small Growth
|
-0.04%
|
3.59%
|
4.85%
|
6.71%
|
6.58%
|
16.36%
|
-1.49%
|
|
MINVX
|
Mosaic Investors
|
Large Blend
|
0.13%
|
3.90%
|
3.94%
|
1.44%
|
3.13%
|
10.30%
|
-0.37%
|
|
MMELX
|
MM Mid Cap Growth
|
Mid-Cap Growth
|
1.40%
|
8.30%
|
8.72%
|
11.47%
|
7.15%
|
13.21%
|
-1.42%
|
|
MMFVX
|
MM Focused Value
|
Mid-Cap Blend
|
1.30%
|
6.07%
|
6.87%
|
7.23%
|
8.17%
|
20.01%
|
-0.96%
|
|
MMYLX
|
MM Small Company Value
|
Small Blend
|
-0.89%
|
3.43%
|
4.41%
|
5.46%
|
3.12%
|
8.29%
|
-2.04%
|
|
MSFRX
|
MFS Total Return
|
Moderate Allocation
|
0.57%
|
3.16%
|
4.10%
|
5.05%
|
5.30%
|
11.83%
|
-0.66%
|
|
NAESX
|
Vanguard Small Cap Index
|
Small Blend
|
-0.38%
|
4.28%
|
5.57%
|
7.59%
|
7.49%
|
18.51%
|
-1.88%
|
|
NBGEX
|
Neuberger Berman Genesis Tr
|
Small Blend
|
0.88%
|
4.50%
|
7.21%
|
9.16%
|
8.44%
|
13.95%
|
-1.57%
|
|
NBGIX
|
Neuberger Berman Genesis
|
Small Blend
|
0.88%
|
4.41%
|
7.07%
|
9.01%
|
8.31%
|
13.77%
|
-1.53%
|
|
NBSRX
|
Neuberger Berman Socially Resp Inv
|
Large Blend
|
1.39%
|
6.25%
|
6.94%
|
7.19%
|
8.21%
|
18.21%
|
-0.79%
|
|
NBSSX
|
Neuberger Berman Focus Inv
|
Large Blend
|
1.45%
|
5.38%
|
5.81%
|
5.06%
|
5.33%
|
11.80%
|
-0.77%
|
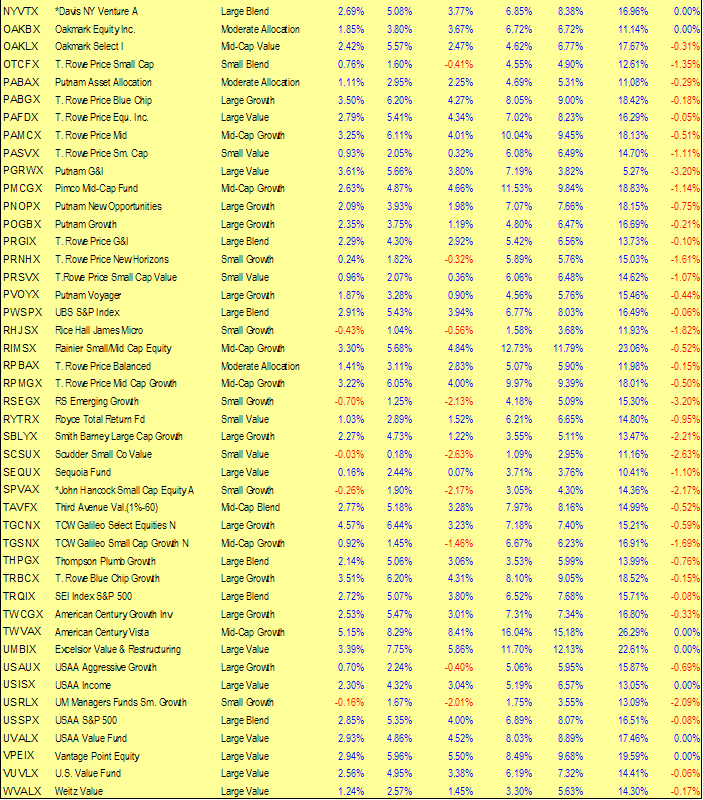
7. New Subscriber Information
To get you a head start on more
successful investing, please click on:
http://www.successful-investment.com/newsletter/How_to_use.pdf
and download our “How to use” information sheet and
last year’s “Buy Signal”
information:
http://www.successful-investment.com/weekly/BuySignal042803.pdf
If you
still need some guidance, feel free to contact me.
Special Notes:
1. I have
taken great care in selecting only mutual funds with no loads and no
redemption fees. However, policies vary from one brokerage house to another.
Before placing any trade, make sure to verify with your broker or custodian
as to any charges and fees involved.
2. Be
aware that, because of the mutual fund scandals, some fund families have
added early redemption fees. While some are reasonable (30 days), others are
ridiculous by trying to tie up the individual investor for 180 days, or
you’re being charged a 2% fee to opt out early. Be sure to check first before
placing any order.
3. Should
there be a sudden change in investment positions, I will send out a special
e-mail bulletin immediately.
4. I will
limit the tracking of 401k funds to only the first 150 submitted to me.
If you
are interested in having your portfolio professionally managed using our
methodology, feel free to contact me directly or visit our website http://www.successful-investment.com/money_management.htm
for more information.
My e-mail
is ulli@successful-investment.com
and my phone is 714.841.5804
Until
next week.
Ulli…
=========================
Ulli G. Niemann
Registered Investment Advisor
714.841.5804
18685 A-Main Street #606
Huntington
Beach, CA 92648
www.successful-investment.com
=========================
DISCLAIMER
(c) Copyright
Successful-Investment.com, 2003. All rights reserved. No portion of the above
message may be republished, retransmitted or forwarded without our express written
consent. Violation of this copyright may result in service cancellation. Use
and/or reliance on this service are strictly at the subscriber's own risk.
Subscriber must maintain compliance with our Terms and Conditions. We will
not be liable for the acts or omissions of any third party with regards to
delay or non-delivery of the 'Successful-Investment' notification. We shall
not be liable for incidental, indirect, special or consequential damages or
for lost profits, savings or revenues of any kind, whether or not we have
been advised of the possibility for such damages.
Ulli G. Niemann is a registered investment
advisor pursuant to the California Department of Corporations. The
information presented herein is for informational purposes only and does not
constitute an offer to sell securities or investment advisory services. Such
an offer can only be made in those states we have established a
"notice-filing" status or where an exemption from notification is
currently available under the de minimis exemption rule.
The investment advisor is an independent
advisor and receives no compensation from any corporations, brokerage houses,
organizations or special interest groups by making recommendations to
purchase any of the investment products used. The advisor is a fee-only
advisor and receives no commissions for client trades.
|