|
|
|
|||
|
|
WEEKLY STATISTICS FOR OUR NO-LOAD MUTUAL FUND AND ETF INVESTMENT PLANS As of By Ulli G. Niemann |
|
|
|
|
IN THIS ISSUE: 1a. General Domestic
Equity Mutual Funds — BUY 1b. Domestic
Vanguard Mutual Funds — BUY 1c. Domestic
Fidelity Mutual Funds — BUY 1d. Domestic T. Rowe
Price Mutual Funds — BUY 1e. Domestic Rydex
and ProFunds Funds — BUY 1f. Domestic
American Century Funds — BUY 2. Domestic Exchange
Traded Funds (ETFs) — BUY 3. International
Equity Mutual Funds/ETFs — BUY 4a. A Global
Perspective — SELECTIVE BUY 4b. Tax-Free
Investing — BUY 4c. Sector Fund
Investing (ETFs) — SELECTIVE
BUY 4d. Fidelity Select
Sector Funds — SELECTIVE BUY 4e. T. Rowe Price,
Rydex & American Century Sector Funds —
SELECTIVE BUY 4f. New Venture 5. On the Horizon:
Bear Market Funds — SELL 6. 401(k) Funds
(domestic) — BUY 7. New Subscriber
Info Weekly Market Comment: The bulls
took charge this week and pushed all major indexes higher. With one trading
day left, we may head into 2007 on a positive note. Our
incremental buying procedure has us in a 100% invested position. TIP: To export the momentum tables to
your spreadsheet, here is an easy way to use Excel's functions to import the
weekly StatSheet data: Open a new Excel worksheet. Go to
Data -> Import External Data and select "New Web Query." In the address window, paste or
type in the link below. Enlarge the window so that you can see it better. By
now you should see my StatSheet tables. Click "Import" on the lower
right hand side. Select the A1 cell and click OK and all of the data is
neatly imported in columns. You can now format the spreadsheet
and save it. Next week, simply change the address and you can import the
current data. http://www.successful-investment.com/StatSheet/SSTables122806.htm Are you interested in reading my possibly
politically incorrect ruminations about the market? I have
set up a blog, aptly named “The Wall Street Bully,”
which will be updated several times during the week. It gives you the
opportunity to post comments and continue the dialog. Take a look at it: http://thewallstreetbully.blogspot.com/ If you have
a newsreader, you can subscribe to it and new updates will be delivered to
you automatically. Alternatively, you can set this link up in your ‘Favorites’
folder and check at your convenience. This is a free service, so please tell
a couple of friends. GLOSSARY OF TERMS USED: 1. 4Wk, 8Wk, 12Wk and YTD refer to
how these funds have performed or “appreciated” during these various time
periods. 2. %M/A (39-week Simple Moving Average)
shows how far above or below its long-term trend line a fund/ETF is currently positioned. 3. “Since 9/6/06” shows a fund’s
performance since that date. This date will be re-set once a new domestic Buy
Cycle starts. 4. DD% (DrawDown percentage) measures the drop from a
fund’s high to its current price during this Buy cycle (since is moving up given current given
economic conditions—which were favorable at the time. It is therefore in tune
with market momentum. Conversely, a fund with a large negative DD% number is a
lagging performer and should not be purchased at this time.time time. 5. MaxDD%
(Maximum DrawDown percentage) is not
shown in these tables, but you will find me mention it quite frequently. If you were to go back to the beginning of the previous
Buy cycle ( trading day, and then select the worst (largest) DrawDown
number, you would have the information that I call MaxDD% (Maximum DrawDown Percentage). This allows me to look back at anytime and see which funds
have held up best and never hit our 7% sell stop. Those are the ones with a low MaxDD% (or low volatility) number
and will be among my primary selections for the next Buy cycle. If you manage your
own portfolio, here’s The
Easier Way to Make Smart Investment Choices My StatSheet data is very complete -- but can you
digest it all? Would you like to save lots of time and have the
drudge work done for you? You can! Take a look at my new Fas-Trac Fund/ETF Investing corner at: 1a. DOMESTIC EQUITY MUTUAL FUNDS: BUY — since
Our
average portfolio (over $50k) has returned +24.81%, after management fees,
for the Buy Cycle (from Our
average portfolio (over $50k) has returned +8.10%, after management fees, for
the Buy Cycle (from Past
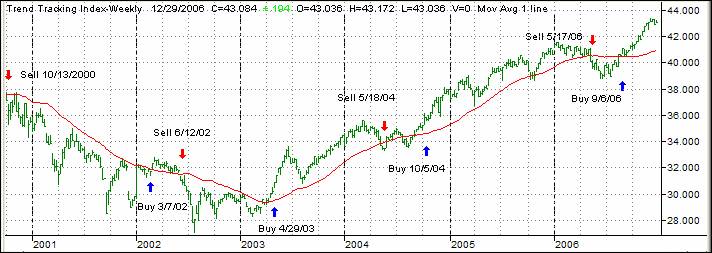
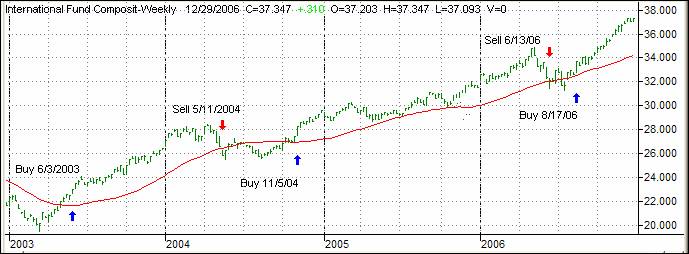
performance is not a guarantee of future results. Our Trend
Tracking Index (TTI) meandered this week (green line in above chart) but
still remains above its long term trend line (red) by a solid +5.39%. My sell
rules are as follows: I will liquidate any of my holdings if they drop by
more than 7% from their highs since I bought them, or if the TTI breaks below
its long-term tend line — whichever occurs first. Since we
don’t know yet if this is the beginning of a new major up trend (lasting at
least 6 months) or simply another head fake, we have to be prepared for both
possibilities.
The first
table below shows the top 25 funds (out of 674) and is sorted by 4Wk
performance. Prices in all tables are updated through Please note, that I only track
no-load, no transaction fee or ‘load waived’ funds, which are available to me
through my custodian Charles Schwab & Co. Since all brokers and
custodians have different policies you need to check with yours first, before
placing any trades, as to no load availability and any charges or fees
involved. I have identified those
funds, which are available to me as “load waived” funds or “advisor only”
funds, with an asterisk before their names. While this may not apply to all
brokerage firms, it should allow you to quickly locate those which are truly
no load.
The
following list shows the top 25 funds out of the 674 we track, but the
sorting order is by 12wk performance:
In the
following table, the data has been filtered as follows: It only
shows the top 25 funds with positive numbers in all momentum columns and a
DrawDown feature of less than -5% (DD%). The sorting
order is by 4 weeks. The
result is that only those funds with consistent performance in all areas are
displayed, which to me represent the top choices for fund selections. Out of
a possible 674, 489 funds qualified and the top 25 are listed this week:
TIP: Don’t forget to check the 401k
funds in section 6 as well, since many of them are available for all types of
investment accounts at different brokerage houses. 1b. DOMESTIC VANGUARD MUTUAL
FUNDS: BUY If you
prefer using the Vanguard family, here are the most commonly held funds. The sorting order is by 4wk momentum:
1c. DOMESTIC FIDELITY MUTUAL
FUNDS: BUY Most
likely you have a reason to follow and track Fidelity funds, be it for your
401k, IRA or brokerage account. The table below lists the most commonly held
ones, sorted by the 4wk momentum column:
1d. DOMESTIC T. ROWE PRICE MUTUAL
FUNDS: BUY This new
addition to our StatSheet allows you to track T. Rowe Price’s funds
separately, in case you prefer having your account with them. Below are their
most commonly held funds:
1e. DOMESTIC RYDEX AND PROFUNDS: BUY These
aggressive fund families are supporting the investing public by having the
most generous trading policies in the industry. If you don’t have an account
directly with them, check with your custodian about any fees that might
affect you. Here are
the most commonly held funds:
1f. DOMESTIC AMERICAN CENTURY
FUNDS: BUY Here’s another
addition to my StatSheet featuring the most widely held funds of the American
Century family:
2. EXCHANGE TRADED FUNDS (ETFs): BUY ETFs are
an excellent alternative to No Load Mutual Funds. They are a valid choice to high
mutual fund management fees, restrictive trading and redemption charges,
which have been a problem for years. If you’re
not sure how to use ETFs please read my FREE article about their pros and
cons, which you may view anytime at: http://www.successful-investment.com/articles24.htm All the
same Buy and Sell rules apply for domestic ETFs as they do for domestic equity mutual funds in
section 1.
3. INTERNATIONAL EQUITY MUTUAL
FUNDS: BUY
— since
The International
Index (green) recovered after the Sell signal on 6/13/06, broke above its
trend line (red), back below it and has currently moved above it by +9.42%. A Buy signal for broadly based
international funds/ETFs (not Country funds) was triggered effective I will
use a 7% trailing sell stop on all of my positions. The
listings below represent some of my choices out of the 95 international funds
I track. Please note that I have added Vanguard, Fidelity, T. Rowe Price,
Rydex/ProFunds and American Century funds. They are
sorted by 4wk performance:
Be
advised that many international funds may not be available to you since they
carry a load. However, while I am able to purchase these for my managed
account clients as ‘load waived’ funds, this doesn’t help you much, if you do
your own investing. This is why I have included some appropriate ETFs in the
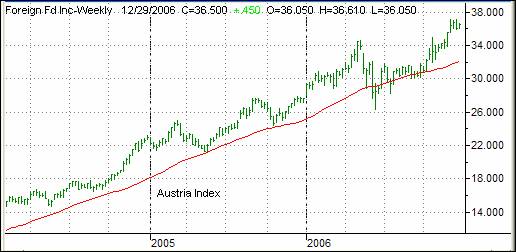
above list. 4a. A GLOBAL PERSPECTIVE: SELECTIVE BUY While I
believe that the I am pleased
to bring you this addition to my newsletter, which will allow us to also
invest selectively in countries with better performing stock markets. With
the proliferation of ETFs over the past years, we are now able to invest in a
variety of countries using low cost index ETFs. The chart
shows the Austria Index as an example:
Below is
a list of 37 countries/regions, which I am tracking weekly. Most
country funds headed south in a big way during the May/June 06 correction,
and I sold the remainder of my positions on
As you
just witnessed during May and June 2006, country funds can be volatile and
the use of a trailing stop loss (I use 10%) is imperative to protect your
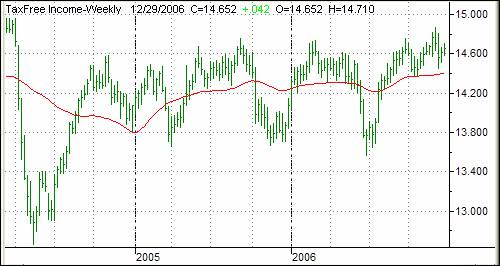
portfolio from severe downside moves. 4b. TAX-FREE INVESTING This
section shows some of the Closed End Exchange Traded Bond Funds (CEETBFs) as
discussed in my free e-Book “How to
Earn 5% - 6.5% Tax-Free Income,” which can be downloaded from my site. This new
addition to the StatSheet is a managed account service I offer. Choosing the
right CEETBF out of over 500 takes a lot of work, and special knowledge is
required to customize a selection of funds specifically suited to your needs.
To
identify the general trend of these funds, I have created the TFI-Index, as
illustrated in the chart below. If the Index (green line) is above its
long-term trend line (red), we are in an environment of lower interest rates.
If it breaks below it, we are seeing interest rates rising.
The table
below is a small sampling of what is available. Be advised that the columns “Discount,”
“Current Dividend Yield,” and “YTD” are updated weekly so that you can see
and track the impact changes in interest rates are having. The data is as of
Please
note that many of these funds have been around for a long time and therefore
10-yr annualized returns are available for most of them. All of them are exempt from Federal taxation and,
depending on what state you live in, maybe exempt from State taxation as
well. Here’s
the glossary of terms used: 1. 1 Yr
Return*: The return over the last 12 months consisting of appreciation and
reinvested dividends. 2. Since
Inception*: The annualized return since the fund started operating. 3. 10 Yr
Annualized Return*: The annualized return over the past 10 years. 4.
Discount from NAV: The discount or premium from Net Asset Value (NAV) this
fund can be currently purchased for. 5.
Average Credit Rating: A key number which shows the quality of the fund with
AAA being the highest. The percentage shows how much of the funds holdings,
as a percentage, are in AAA rated bonds. 6.
Morningstar (MS): The current Morningstar rating. NR means that it is not yet
rated. 7.
Current Div. Yield: That’s the income being generated and it is paid out on a
monthly basis, if you wish. This represents spendable
income. 8. YTD:
Shows the Year-To-Date performance (without dividends) to demonstrate the
effect of changes in interest rates. Some funds are showing capital gains,
other capital losses. This is a very short-term view. These types of
investments should only be made with at least a 5-year time horizon. There are
many other factors, which come into play, when evaluating CEETBFs. This
section is only designed as an introduction. If you do your own investing in
this area, be sure to read my new article titled “The 10 Rules of Successful Tax-Free Income Investing,” which is
posted at: http://www.successful-investment.com/articles31.htm If you have
a need to generate reliable monthly income, please call me, or go the
following link and submit your request: http://www.successful-investment.com/TFI *As of 4c. SECTOR FUND INVESTING (ETFs): SELECTIVE BUY To
diversify our portfolios, we always need to look for different opportunities
to invest our money. The below table of sector fund listings (ETFs) covers a
broad spectrum of possibilities. The sorting order is by 4Wk performance:
I
personally invest no more than 5% of portfolio value in any one sector and
use a 10% trailing stop loss to minimize the risk. I have taken a new
position and will add more if market momentum keeps improving. 4d. FIDELITY SELECT SECTOR FUNDS: SELECTIVE BUY If you
prefer using Fidelity’s wide variety of excellent sector funds, you will like
this new addition. Here as well, sectors can be volatile, and I advise the
use of a sell stop just as we do with ETFs. The
sorting order is by 4Wk performance:
4f. T. ROWE PRICE, RYDEX &
AMERICAN CENTURY SECTOR FUNDS: SELECTIVE BUY This is
my latest addition to the StatSheet, which features sector funds from these
three fund families:
4f. NEW VENTURE If you
prefer having an aggressive ingredient in part of your assets, the New
Venture Opportunity ETFs, which focus on future oriented sectors such as
biotech, water, clean energy and nanotech, for example, can help boost a
portfolio’s return. To work
profitably for you, these more volatile investments have to be managed with
discipline through the use of a clearly defined exit point just like sector
funds. I personally use a 10% trailing stop loss and will not commit more
than 5% of portfolio value to any one position. As you
can see, most of these ETFs have only been around for a few months, so %M/A
data is not yet available.
All of
them are PowerShares ETFs, and I am certain that
this list will be expanded as more become available. I will wait for stronger
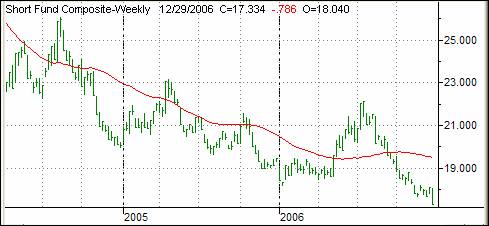
momentum figures before making any new purchases. 5. ON THE HORIZON: Bear Market
Funds: SELL
The above
indicator represents our Short Fund Composite (SFC) to be used as a trend
indicator for Bear Market Funds. After
having stayed above its long-term trend line during the correction of
May/June 06, the SFC has now broken below it by -10.83%. I will not take any
positions until our TTI (section 1) breaks ‘below’ its trend line and the SFC
breaks ‘above’ its trend line, which would confirm bearish tendencies, before
I consider committing to this market. Below are
the most commonly available bear market funds and their momentum figures:
Please
note that some of the above funds try to outperform the index they are tied
to by the percentage stated. While this can enhance your returns it can
certainly accelerate your losses as well. Personally, I prefer the
conservative route and, therefore, I will not use the leverage available. 6. 401(k) Funds (domestic): BUY Below is
a list of commonly held 401(k) domestic
equity mutual funds showing their latest momentum figures to go along with
the Buy and Sell signals of the TTI in section 1. The same stop loss rules
apply here as well. Since
fund choices are limited in any 401k plan, be sure to roll your assets into
an IRA if you leave your job. Let me know if you need help with that. In the meantime,
however, you can benefit greatly by at least not buying the worst fund at the
wrong time. If you follow our plan, you will never again buy one of those
highly volatile sector funds, when you really should be out of the market
altogether. Since this
list has grown quite a bit, I have sorted it now by Ticker Symbol in
alphabetical order. This should make it easier for you to locate those funds
you are tracking:
The
Are you spending more time than you like dissecting
the mutual fund/ETF data in my StatSheet or in other sources you may use?
There is a faster and easier way for you to get to the real meat. Check out my new Fas-Trac Fund/ETF Investing opportunity featured at: 7. New Subscriber Information To get you a head start on more successful
investing, please click on: http://www.successful-investment.com/newsletter/How_to_use.pdf and download our “How to use” information sheet and
last year’s “Buy Signal”
information: http://www.successful-investment.com/weekly/BuySignal042803.pdf If you
still need some guidance, feel free to contact me. Special Notes: 1. I have
taken great care in selecting only mutual funds with no loads and no
redemption fees. However, policies vary from one brokerage house to another.
Before placing any trade, make sure to verify with your broker or custodian
as to any charges and fees involved. 2. Be
aware that, because of the mutual fund scandals, some fund families have
added early redemption fees. While some are reasonable (30 days), others are
ridiculous by trying to tie up the individual investor for 180 days, or
you’re being charged a 2% fee to opt out early. Be sure to check first before
placing any order. 3. Should
there be a sudden change in investment positions, I will send out a special
e-mail bulletin immediately. 4. I will
limit the tracking of 401k funds to only the first 150 submitted to me. If you
are interested in having your portfolio professionally managed using our
methodology, feel free to contact me directly or visit our website http://www.successful-investment.com/money_management.htm
for more information. My e-mail
is ulli@successful-investment.com
and my phone is 714.841.5804 Until
next week. Ulli… ========================= Ulli G. Niemann Registered Investment Advisor 714.841.5804 =========================
DISCLAIMER (c) Copyright
Successful-Investment.com, 2003. All rights reserved. No portion of the above
message may be republished, retransmitted or forwarded without our express
written consent. Violation of this copyright may result in service
cancellation. Use and/or reliance on this service are strictly at the
subscriber's own risk. Subscriber must maintain compliance with our Terms and
Conditions. We will not be liable for the acts or omissions of any third
party with regards to delay or non-delivery of the 'Successful-Investment'
notification. We shall not be liable for incidental, indirect, special or
consequential damages or for lost profits, savings or revenues of any kind,
whether or not we have been advised of the possibility for such damages. Ulli G. Niemann is a registered investment
advisor pursuant to the California Department of Corporations. The
information presented herein is for informational purposes only and does not
constitute an offer to sell securities or investment advisory services. Such
an offer can only be made in those states we have established a
"notice-filing" status or where an exemption from notification is
currently available under the de minimis exemption rule. The investment advisor is an independent
advisor and receives no compensation from any corporations, brokerage houses,
organizations or special interest groups by making recommendations to
purchase any of the investment products used. The advisor is a fee-only
advisor and receives no commissions for client trades. |
||||